Ken Gregory
November 26, 2011
Climate Models vs
Observations
Bob
Tisdale runs a climate blog website "Bob Tisdale - Climate Observations".
He has recently written several excellent posts which compare temperature
series to hindcasts of computer models used by the IPCC. I have selected
six graphs from his posts to present in this short article. These graphs are
also presented in the "Climate Models Fail" section of my Climate Change Science
essay here,
which is linked to the Friends of Science website. Links to the posts from which
the graphs came are given below. Readers are encouraged to read the source posts
for further information.
Computer model hindcasts should be compared to the actual historical observations to determine how well the models matched the historical record. A model that fails to history match will not produce realistic projections.
The animation below compares observed North Atlantic temperature anomalies to the modeled surface air temperatures for the 6 individual ensemble members and the ensemble mean of the National Center for Atmospheric Research (NCAR) coupled climate model CCSM4. All data have been smoothed with a 121-month filter.
Bob Tisdale writes "The NCAR CCSM4 coupled climate model appears to do a poor job of hindcasting the multi-decadal variability of North Atlantic temperature anomalies." See here.
The animation below compares the Sea Surface Temperature (SST) in the NINO 3 region to the climate model hindcasts. NINO 3 is a region in the Eastern Pacific tropics where El Nino Southern Oscillation (ENSO) events occur. ENSO is a natural SST oscillation expressed as warming El Nino and cooling La Nina events. The animation shows how poorly the models hindcast the frequency, magnitude, and trend of ENSO events. The model ensemble mean trend is 14 times greater than the trend of the observations.
Bob Tisdale writes "the frequency and magnitude of El Nino and La Nina events of the individual ensemble members do not come close to matching those observed in the instrument temperature record. Should they? Yes. During a given time period, it is the frequency and magnitude of ENSO events that determines how often and how much heat is released by the tropical Pacific into the atmosphere ..."
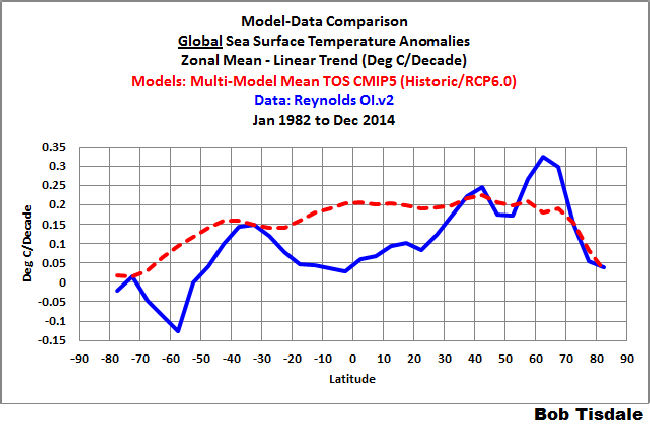
The graph below compares the linear trends for the observations and the model mean of the IPCC Fourth Assessment Report hindcasts/projections of SST for the period of January 1982 to February 2011 in 5-degree-latitude bands. The models predicted much greater warming trends in the tropics than what was observed. The actual warming in the northern regions is greater than modeled. Warming was predicted in the southern region but the SST trend was actually negative in much of the region. This shows that the models do an extremely poor job at simulating how tropical heat is transported to the Polar Regions. See here.
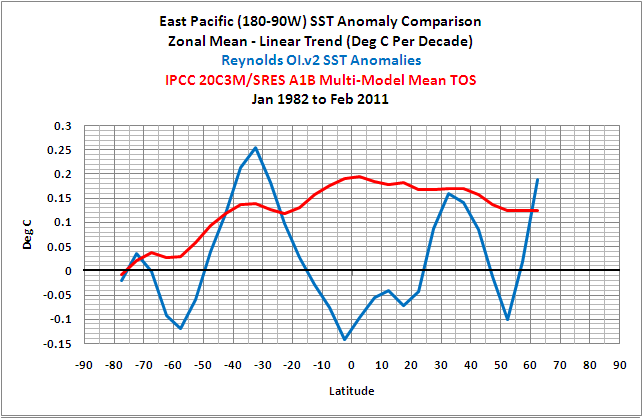
The graph below compares the Easter Pacific SST to models by latitude. This includes the important El Nino region so a good history match here is critical. The Eastern Pacific tropical SST has declined at the equator at 0.14 C/decade, but the models show a strong warming of 0.19 C/decade. See here.
The graph below compares SST observations to climate model outputs for the period of 1910 to August 2011. The SST is from the HADISST dataset and the model hindcast is the IPCC model mean published in 2007. The models do not match the temperature variability in the period 1910 to 1975. They are made to match the warming trend from 1975 to 2002 by assuming most of the warming is due to CO2 and using high sensitivity to greenhouse gases. The projections diverge from observations after 2002 despite the continued increase in CO2 emissions. See here.

The graph below compares the 17-year (240 months) trends of the global SST to the IPCC model mean. Each point on curves represents the 17-year straight-line best-fit trend to that point in time. The IPCC models projected the global 17-year SST trend ending August 2011 at 0.15 C/decade, but the observed rise was only 0.02 C/decade. See here.
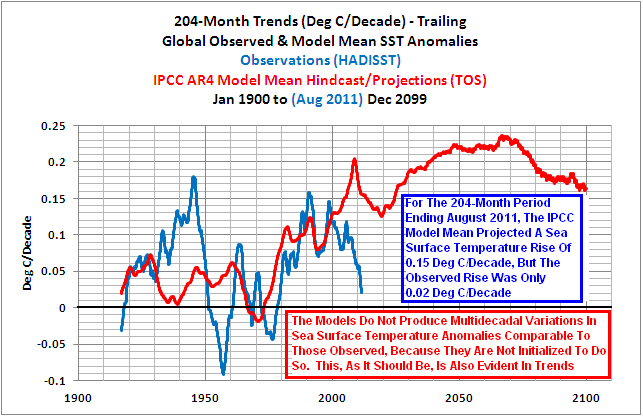
Bob Tisdale writes, "The coupled climate models used to hindcast past and project future climate in the IPCC 2007 report AR4 were not initialized so that they could reproduce the multi-decadal variations that exist in the global temperature record. This has been known for years." and "The climate models used by the IPCC appear to be missing a number of components that produce the natural multi-decadal signal that exists in the instrument-based Sea Surface Temperature record."
Many important inputs to climate models are very uncertain and
real world observational evidence does not support them, so it is foolish to
rely on their projections to make expensive policy
decisions.