

SEPTEMBER 2017
FOS MEMBERSHIP QUARTERLY NEWSLETTER
No. 55
The PDF version of this newsletter is here.
FoS is dedicated to providing the public with insight into Climate Science
PRESIDENT 'S MESSAGE
Friends of Science is celebrating our 15th year of bringing climate science and policy information to you. We issued our annual report in September. The report gives a brief summary of our activities during 2016, a little history of our society and describes our scientific and policy positions. It highlights many of our major reports on a variety of issues. These include LOOK Before You Leap , which is a rebuttal of the LEAP Manifesto document that advocates for a 100% renewable energy electrical grid, Keep Canada in the Black which rebuts false claims that fossil fuels in Canada are subsidized, Markets Skewed which shows how ENGOs and others harass banks and financial institutions with false claims of harmful effects of fossil fuel use, and several other reports.
Ecojustice issued a complaint against us to Canada 's Competition Bureau in December 2015, falsely alleging that statements made on our website and billboards about climate change are misleading . We received a letter dated June 29, 2017 from the Bureau stating that the inquiry has been discontinued. Ourpress releaseon this issue has links to several articles in the media. One article published on Sept. 17, 2017 in theToronto Starstated the Ecojustice accused us of making false and misleading claims about climate change. For example, that the sun, not man, is its main cause and that carbon dioxide is not a pollutant. ... That the Competition Bureau investigated this complaint at all is absurd and chilling. Absurd because climate alarmist groups make equally false and misleading claims all the time. Well yes, alarmist groups do make misleading claims are the time, and we rebut many of them. But the statement falsely implies that our statement The Sun is the main driver of climate change is misleading. It is not misleading. It is supported by empirical evidence as indicated in ourclimate science newsletterof Sept. 7 article Contribution of CO2 and Sun/Oceans to Global Warming which states from 1910 to 2016 the sun has caused 3.8 times more climate change, warming and cooling, than the warming from CO2. The effects of the sun include ocean cycles as the sun is the ultimate driver of natural ocean currents and their oscillations through evaporation and the uneven heating of the oceans. Some scientists say ocean cycles are internally generated.
The City of Calgary has been actively engaged in incorporating climate change planning into almost every level of municipal culture. The fear of climate change has too often caused a diversion of funds from serious municipal needs like flood mitigation, infrastructure and social programs. We issued two reports on the City of Calgary 's Climate Change Plan.
Friends of Science has recently completed a business plan/funding document which we will use to encourage people and organizations to contribute funds to us. The document gives a summary of our recent work and what we plan to achieve if we continue to receive adequate funding and what we can do with increased funding. Please let us know if you can help us with our fundraising campaign.
The main menu of the Friends of Science website has been simplified in preparation for implementing a new, mobile friendly template. Over the last three months, 37 excellent articles were posted to our blog, seven new videos where posted to our YouTube page, 16 press releases and 10 article were posted on our Friends of Science website. Our Facebook page remains very active. Please share these informative articles and videos with friends, politicians and the media.
POLITICAL DEVELOPMENTS
Calculating the Social Cost of CO2 Emissions
In June 2016 the National Post published articles for its Junk Science Week series. One of these, by economist Ross McKitrick, is titled: What 's the right price for carbon? Take a guess (everyone else is). In that article Dr. McKitrick discussed three integrated assessment models (IAMs) called DICE, FUND and PAGE that now have a large and growing influence over your life. These models are simplified representations of the world economy and climate, which academics and government agencies use to calculate the social cost of CO2 emissions (SCCO2), more often called the social cost of carbon (SCC).
The Obama administration set up an Inter-Agency Working Group (IWG) to devise an SCC estimate for use in regulation. In 2010, using the three IAMs, the IWG reported an average SCC of US$26.30/t for 2015, rising to US$44.90/t in 2050. In 2013 and 2015 the IWG used updated models to come up with higher SCC values. The main reason for the increase was a change in a parameter called the equilibrium climate sensitivity (ECS) the eventual temperature rise in °C resulting from a doubling of the atmospheric concentration of CO2. The IWG noted that the value of ECS is uncertain and could range from zero to ten degrees, so it relied on a probability distribution. This distribution gives a mean value of 3.5 °C. Dr. McKitrick relied on a 2015 paper by scientists Nicholas Lewis and Judith Curry, which Dr. Curry described in her blog. The Lewis and Curry paper estimated the ECS as 1.64 °C.
Later Dr. Lewis reduced his ECS to 1.45 °C by using new aerosol estimates, but even this failed to account for natural climate change (the millennium cycle recovery from the Little Ice Age) and the urban heat island effect. Adjusting for these factors gives an ESC best estimate of 1.02 °C. Therefore, the SCC calculations herein use ECS values of 3.5 °C and 1.0 °C.
In 2010 and 2011 Environment and Climate Change Canada (EC) decided to adopt the SCC recommendations of the IWG, converting them from US to Canadian dollars. EC 's March 2016 Technical Update to Canada 's Social Cost of Greenhouse Gas Estimates, defines the SCC (on page 1) as an estimate of the monetary value in a given year of worldwide damage that will occur over the coming decades and centuries from emitting one additional tonne of carbon dioxide (CO2) emissions. Specifically, the SCC represents the marginal damage of an additional tonne of CO2 emitted into the atmosphere in a given year, expressed in dollars, based on an assumed global CO2 emissions path.
In practice, what the IWG did is assume emission of one additional tonne of CO2 in a given year and run the IAMs to determine the resulting annual damages worldwide over subsequent decades and centuries. Then it discounted these future damages (expressed in US$) and summed them to produce a single number for each model the SCC. Then it averaged the results for all three models. The IWG calculated the damages out to 2300 using three discount rates (2.5%, 3% and 5%), settling on 3% as the recommended value. Because of the compounding effect, with a 3% rate a dollar of damages in 2300 is worth only $0.0002 today.
One of the IAMs used by the IWG, FUND, is freely available for download and use by anyone with coding skills and some knowledge of the Julia language (needed to study the FUND code and then use it for calculations and analysis). As noted above, FUND and the other IAMs use simplified representations for the world economy and climate. In fact, FUND is simple enough to run on a desktop computer. FUND 's home page contains additional information and references to various publications that relied on the model.
Figure 1 shows FUND 's calculated annual global costs associated with a one-tonne release of CO2 in 2020, for ECS values of 3.5 °C and 1.0 °C. This calculation used one of five scenarios considered by the IWG, called Base or business-as-usual.
Two things to note: The ECS has a significant effect on the annual marginal damages, and the generally-smooth curves show some sharp changes in certain years. This is because FUND divides the world into 16 regions (USA, Canada, Western Europe, Japan-Korea, Australia-New Zealand, Eastern Europe, Former Soviet Union, Middle East, Central America, Latin America, South Asia, South-East Asia, China, North Africa, Sub-Saharan Africa and Small Island States), calculating the damages for each and adding them to arrive at a global total for each year.
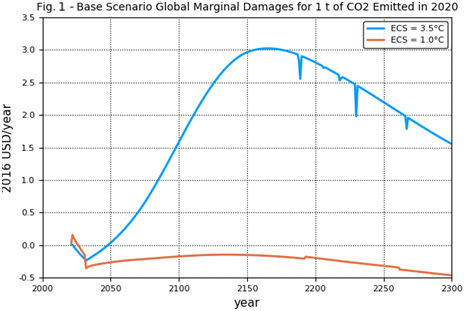
Sudden year-to-year changes in one or more regions can be large enough make a noticeable difference to the global total. The regional damages include a variety of costs (e.g., income; heating; cooling; agriculture; loss of biodiversity, water resources; tropical and extra-tropical storms; forests; protection against and loss of dry and wet lands from sea-level rise; migration effects of sea-level rise; death; and morbidity). Calculating these using multiple parameters and simplifying assumptions built into the model and combining them into one total does not guarantee realistic results.
As described above the SCCO2 is calculated by discounting and summing annual damage costs like those depicted in Figure 1. Table 1 shows SCCO2 values calculated at decade intervals from 2010 to 2050, for both ECS values.
Table 1 Calculated Social Costs of CO2 Emitted in Various Years (2016 US$/tCO2)
|
Emission Year |
ECS = 3.5 °C |
ECS = 1.0 °C |
|
2010 |
8.3 |
-4.4 |
|
2020 |
11.1 |
-6.0 |
|
2030 |
15.9 |
-8.2 |
|
2040 |
23.5 |
-7.6 |
|
2050 |
32.0 |
-7.6 |
For an ECS of 3.5 °C the calculated SCCO2 values increase significantly with the year of emission. This gives governments justification for steadily increasing carbon taxes (or cost of emissions permits for cap-and-trade schemes.) However, for an ECS of 1.0 °C the SCCO2 values are negative. In other words, emissions of CO2 produce a net benefit. It is worth noting a quote from Dr. McKitrick 's article: The numbers produced by the IWG have a large and growing influence over energy and economic policy in the U.S. and Canada and elsewhere. Unfortunately, for all its claims about following the science, where it really counts it ended up peddling guesstimates based on inconsistent models. To borrow a phrase, it is time to restore science to its rightful place. Calculations behind the social cost of carbon need to reflect empirical evidence about low climate sensitivity, and when this is done, the numbers appear to be much lower than those currently in use.
Note: Figure 1 and Table 1 was revised November 11, 2017 due to correcting units from tC to tCO2. An expanded version of this essay, containing more information about FUND and additional plots, is available on the Friends of Science website here.
SCIENCE NEWS
More Time to Avoid 1.5 °C Warming
A paper by a prominent group of climate scientists has recalculated the amount of CO2 emissions that may cause 1.5 °C warming from pre-industrial times (1850). The abstract says We show that limiting cumulative post-2015 CO2 emissions to about 200 GtC [gigatonnes of carbon] would limit post-2015 warming to less than 0.6 °C in 66% of Earth system model members of the CMIP5 ensemble with no mitigation of other climate drivers, increasing to 240 GtC with ambitious non-CO2 mitigation. This is a lot more than indicated in the IPCC fifth assessment report that estimated only 70 GTC can be emitted after 2015 to avoid 1.5 °C from 1850, or 0.6 °C from 2015. The reason for the large increase in allowed emissions is because the actual warming has been much less than predicted by climate models. The extraordinary thing about the paper is that this is the first time a group of climate alarmist scientists have admitted that they were wrong about global warming. Myles Allen, a co-author of the study, said We haven 't seen that rapid acceleration in warming in the observations after 2000 that we see in the models. There has been a lot of commentary about this paper in the media and blogs, but they all seem to miss a critical point that the paper did not change the forecasted temperate change, or climate sensitivity to CO2 emissions, from 2015 onward despite the slowdown of warming seen in the temperature record. The climate models were tuned to match the 1975 to 1997 warming rate of 0.17 °C/decade, but the rate slowed for the period 1998 to 2015 to only 0.11 °C/decade using surface temperature from HadCRUT4.5, or only -0.01 °C/decade using satellite data. Empirical based estimates of climate sensitivity estimates are much less than estimated by climate models. These authors will likely have to increase the carbon budget again in a few years as the world fails to warm as much as the models forecast. See the Independent, UK article here, and a Breitbart article here.
Did CO2 Emissions Cause the 12-yr Absence of Major US Hurricane Landfalls?
Hurricanes Harvey and Irma have intensified the talk about anthropogenic global warming causing more frequent and powerful hurricanes. But does warming cause more hurricanes? And why was there a nearly 12 year absence of major (Cat 3+) hurricanes making landfall in the USA? Prior to hurricanes Harvey and Irma, the last major hurricane to make USA landfall was Wilma striking Florida on October 24, 2005. Dr. Spencer says that the absence of major hurricane USA landfalls over 11 years should occur only every 560 years, but we should expect 2 category 4 or 5 hurricanes to strike the USA in a single year every 50 years on average. A number of factors need to be just right for a strong hurricane to develop. Hurricanes require a large temperature difference between the sea surface and the cloud tops, but standard global warming theory shows that in a warming world the cloud tops will warm faster than the surface, reducing the temperature difference that powers hurricanes. They also require a pre-existing cyclonic circulation off the African coast, and low wind shear. A paper published September 14, 2017 that used a fine mesh climate simulation designed for tropical cyclone (TC) studies finds that the global frequency of tropical cyclones [hurricanes, cyclones and typhoons] is reduced by 23% in response to a 1.3 °C global temperature rise, while the ratio of intense TC to all TC is increased by only 6.6%. This suggests that the nearly 12 year lull of hurricanes may be credited to our CO2 emissions. This is another benefit of CO2 that is not included in calculations of the social cost/benefit of CO2. The lack of wind shear in the Atlantic this hurricane season has allowed many hurricanes to form and intensify. Hurricane formation is strongly affected by the Atlantic Multi-decadal Oscillation, a natural ocean cycle. The global accumulated cyclone energy shows significant decadal changes but no trends as shown in this graph. The TC frequency had declined significantly since 1992-1998 period, see graph. The Atlantic, Caribbean, and Gulf of Mexico are warm enough every summer and fall to produce major hurricanes. Texas had 11 major hurricane strikes when the sea surface temperature of the Gulf of Mexico was above average and 11 when the temperatures were below average since 1870. The wealth created by fossil fuel use has enabled developed countries to greatly reduce deaths from severe hurricanes. The category 4 Galveston hurricane killed about 8000 people in September, 1900. Harvey and Irma killed 82 and 93, respectively. Stronger buildings, good transportation and communication infrastructure, and warnings have greatly reduced deaths from cyclones. They still cause great devastation and deaths in poor countries such as 138,000 fatalities due to cyclone Nargis in Myanmar (also called Burma) in May, 2008. Heed the warnings and keep safe!
VICE PRESIDENT 'S CORNER
The Pollution Solution to Climate Change Stop the Madness
Save the world with Geoengineering is the latest rallying cry of the environmental alarmist. Whatever happened to the 70s ' anti-pollution rallying cries? We then had:
Those were true words of a generation that fought to rid our skies of noxious pollutants. That generation succeeded. The majority of us today, at least in the west, no longer suffer from sulphur dioxide induced acid rain and we have catalytic converters on our cars to rid us of the carbon monoxide that was common from gasoline combustion. Specifically, in 2015, Canadian SO2 concentrations were 92.3% lower than in 1972 and CO concentrations were also 90.4% lower for the same time period.
Today the so called environmentalists are proposing: to put 5 billion tons of sulphates a year into the atmosphere 20 kilometers high, and we 'll do that for 50 years in order to supposedly cool down the Earth. Excellent, what if they get it wrong and thrust us into a perpetual winter? I personally prefer annual winter seasons not century long Game of Thrones like winters.
Luckily, so far at least, the United Nations Framework Convention on Climate Change (UNFCCC) has noted that sulphate aerosols remain in the atmosphere for a relatively short time compared to the long-lived greenhouse gases, so their cooling effect is localized. They also cause acid rain and poor air quality . Let 's hope they heed their own words and not decide to try and fix the planet.
For those of you wondering, what harm could trying do? According to the Historical Anthropogenic Sulfur Dioxide Emissions dataset, from NASA 's Socioeconomic Data and Applications Center (SEDAC), in 2015 humans emitted 115.5 million Tonnes of SO2; which translates to 127.3 million tons. So, rhetorically I ask: What harm could there be in adding 5 billion tons or 39 times the annual human emissions to our atmosphere?
Let 's remember the air, the air is everywhere . Let 's not poison it.
The sun is a marvelous sight 1000 kilometres for a couple of fabulous minutes
 On August 21st, North America was provided with an astral show that those lucky to have seen it firsthand will never forget. Earlier this year I got it in mind that a little road trip from Calgary to somewhere in Idaho, a mere 1009 km, would be a fun way to spend a couple of days. Much planning over maps to find the best viewing location and many months of uncertainty about the weather ensued. Funny thing about viewing things in the sky, clouds are not your friend.
Anyways, Sunday morning came and after a last interpretation of the weather maps my daughter and I got on the road. Our first 711 km took us to Butte Montana, the location of the nearest hotel I could book back in May. Eclipse morning we rose very early for breakfast at 6 am and got on the road for the remaining 300 km.
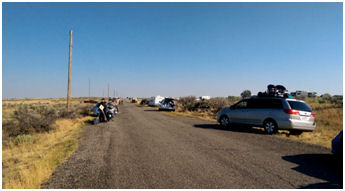
 Traffic was light and we arrived in plenty of time to set up with a spectacularly clear sky. It was amazing to see thousands of people that had filled every parking spot just off the interstate. We found our spot as planned on Blue Stem Rd., a little side road parallel to the I15. It was perfection.
The moon started to cross in front of the sun at 10:15 am but without proper eye protection you wouldn 't have known anything was happening. Around 11:00 am the temperature got noticeably cooler and ended up dropping about 12 °C (~22 °F) from the high around 10:30 am. The temperature took over an hour to recover to the earlier high. Fantastic demonstration of the power our sun provides in our daily warming cycles.

The sky only started to visibly darken at 11:25 am. It was the fastest sunset ever. Within minutes it was very dark and many stars and planets were clearly visible. The light came back impressively quickly when totality ended.
Of course the real reason we drove all that way was not to measure temperatures but to see the eclipse. As I mentioned we had proper shade 14 welding glass to view the eclipse for the entire three hours. The totality picture captured Regulus to the bottom left of the sun.

Even though totality was only 2 minutes 17 seconds the show was spectacular.
FROM THE FUNDRAISING COMMITTEE: MEMBERSHIPS AND DONATIONS
Friends of Science Society is embarking on a fundraising drive. You can help us expand our pool of members and donors. Do you have a local chamber of commerce or service club? Invite one of our speakers or ask for one of our presentations and present it yourself (or perhaps do your own version if you feel up to it). If every person brought us five new people, it would make a huge difference to our ability to get out the message.
This debate matters, you are making a difference.
Please continue to make donations to Friends of Science. Share our materials by email, tweet, Facebook or anyway you please. We can be a voice for your climate change issues and we thank all of you who have given us tips on the misinformation they see in the marketplace. We have made aggressive outreach efforts with short, current commentaries on video. This is an ongoing cost, but we get good response from people who might not read our reports.
We need 'all hands on deck' this year, as there will be an IPCC conference in Edmonton in the early spring of 2018. This will be challenging for us - but it also will raise our profile and all kinds of opportunities to respond and call out the ideological side for their lack of due diligence.
For us to make sure our voice is heard, we will need much more support - personal, financial, and through your networks of friends and colleagues. Thank you for your continued support.
To make a contribution at friendsofscience.org click on Become a Member/DONATE in the upper right of the home page. If you prefer to phone us to pay by credit card please call 1-888-789-9597 Ext 2.
Alternately, you can mail donations to Friends of Science at the following address:
Check out our social media platforms: