
Here is a set of real time graphs from satellite data showing the polar regions sea ice extents and volume.
Plots open in a new tab.
From The National Snow and Ice Data Center (US):
Click here for the Arctic sea ice extent August - December
Click here for the Antarctic sea ice area August - December
Click here for the Antarctic sea ice area August - December
Click here for an interactive Arctic and Antarctic sea ice extent January - December
From Climate4You:
Click here for the Arctic sea ice extent from 2002-06 via Japan Aerospace Exploration Agency (JAXA)
Click here for the Arctic sea ice extent from 2000-01 via National Snow and Ice Data Center (US)
Click here for the Antarctic sea ice extent from 2000-01
Click here for the Global sea ice extent from 2000-01
Click here for the Global, Arctic and Antarctic sea ice extent from 1979 (incorrecly labeled area)
From IUP, University of Bremen:
Click here for sea ice maps
From Arctic Archive Data System (ADS), Japan
Click here for a real time graph showing the Arctic, Antarctic and Global sea ice extent.
Click here for Arctic Seasonal all years from 1978
Click here for Antarctic Seasonal all years from 1978
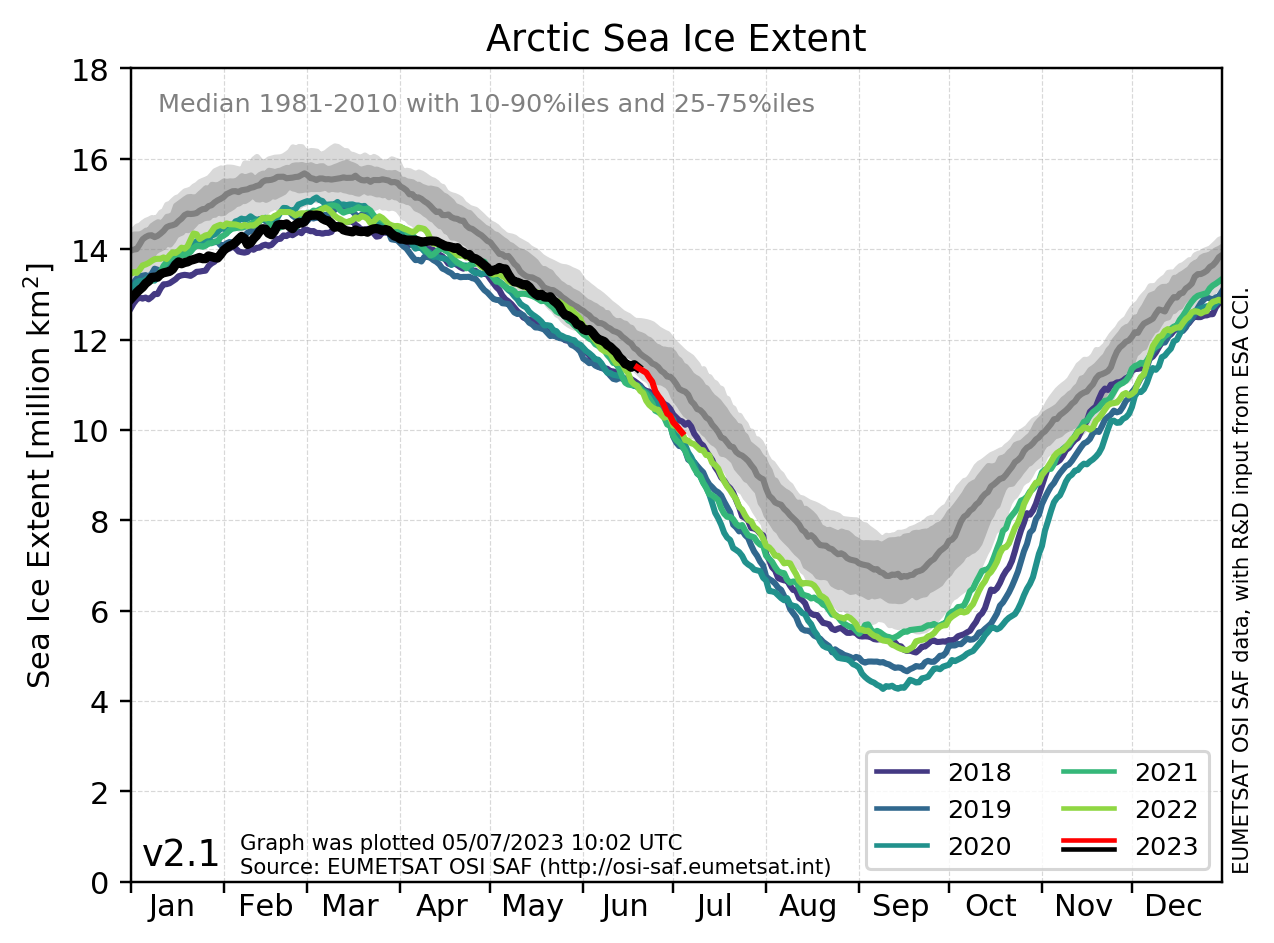
From Danish Meteorological Institute, Ocean and Ice Services
Click here for the Arctic sea ice extent
Click here for the Arctic sea ice volume
Polar Temperatures from Satellite Data
Click here for the Northern Polar Temperatures from UAH satellite data.
Click here for the Southern Polar Temperatures from UAH satellite data.
Monthly and Annual Global Sea Ice Extent

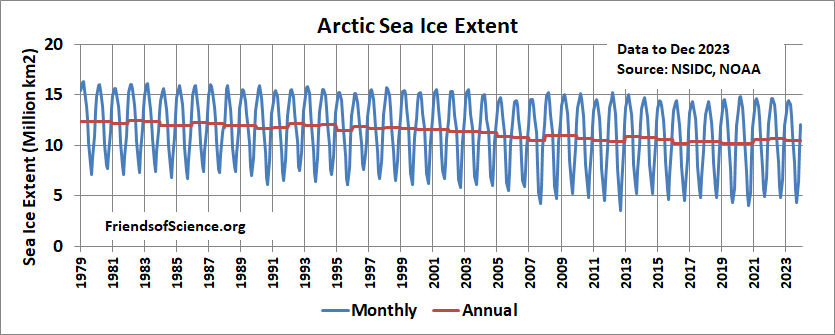
Monthly and Annual Arctic Sea Ice Extent
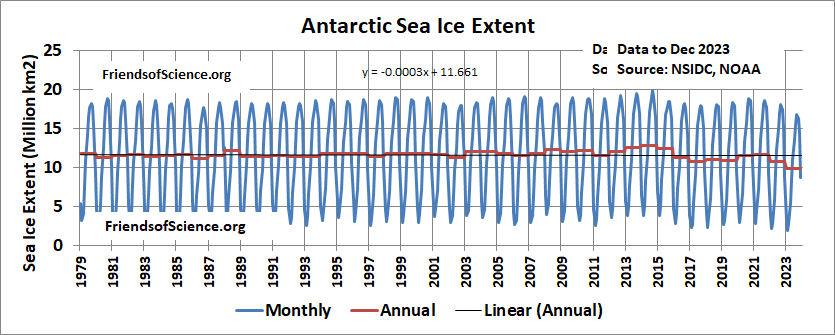
Monthly and Annual Antarctic Sea Ice Extent
©2002-2026 Friends of Science Society