Dr. Roy Spencer presented in a series of blog post the results of a new technique to estimate the average amount of urban heeat island (UHI) warming accompanying ans increase in population density.
In his post of March 3, 2010 here, Dr. Spencer descripes his procedure usihg year 2000 temperature data. Briefly, all station pairs within 150 km of each other had their 1-year average difference in temperature related to their difference in population. For each pair of closely spaced stations, if the higher-population station is in population interval #3, and the lower population station is in population interval #1, I put that station pair 's year-average temperature difference in a 2-dimensional (interval#3, interval#1) population bin for later averaging. All station temperatures were adjusted to sea level using 5.4 ºC/km elevation. Spencer calculates a warming per population density increment for each average of the station pair population densities, and then computes the average cumulative warming from a population density of zero.
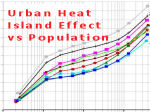
The results show that the most rapid rate of warming with population increase is at the lowest population densities. Year 2000 data shows that the average UHI effect at a population density of only 100 persons per sq. km is almost 1.1 ºC.
Dr. Spencer presented updated results using data for the years 2000 through 2009 is a blog post here. All these years show clear evidence of UHI warming, even for small population density increases at very low population density. A population density of only 100 persons per sq. km exhibits average warming of about 0.8 ºC compared to a nearby unpopulated temperature monitoring location. He also presented results for the USA and non-USA stations. The USA results show much less warming with an increase in population density than the Non-USA stations.
Dr. Spencer presented updated results here by included more station temperature and population data by removing his previous requirement that two neighboring temperature measurement stations must have similar fractions of water coverage. He also adjusted the population bin boundaries used for averaging to provide more uniform numbers of station pairs per bin. This increased the overall UHI warming effect, with about 1.1 ºC average warming at a population density of 100 persons per sq. km. The UHI warming at a population density of 1000 persons/sq. km is about 1.4 ºC, and at 10,000 persons/sq km is about 1.9 ºC.
The figure below shows a) the Global average UHI warming by year, and b) the 10-year average USA and non-USA UHI warming.

