This study by
- Mean surface temperature in China has warmed by 0.8 ¯ °C since 1950.
- Atmospheric boundary layer physics predicts higher UHI warming during night.
- The divergence between Tmin and Tmax is used to detect urbanization biases.
- The China regions with the strongest Tmin-Tmax divergence are also the most populated.
- Thus, the temperature warming in China is partially due to UHI biases.
Abstract
Near-surface temperature records show that China warmed by about 0.8 ¯ °C from 1950 to 2010. However, there exists an ongoing debate about whether this warming might have been partially due to urbanization bias. In fact, homogenization approaches may be inefficient in densely populated provinces that have experienced a significant urban development since the 1940s. This paper aims to complement previous research on the topic by showing that an alternative approach based on the analysis of the divergence between the minimum (Tmin) and maximum (Tmax) near-surface temperature records since the 1940s could be useful to clarify the issue because urban heat island (UHI) effects stress the warming of nocturnal temperatures more than the diurnal ones. Then, the significance of the divergence observed in the data could be evaluated against the expectations produced by the CMIP5 general circulation model simulations. From 1945 1954 to 2005 2014, on average and over China, these models predict that Tmin had to warm 0.19 ¯ ± ¯0.06 ¯ °C more than Tmax. However, during the same period, the climatic records show that Tmin warmed 0.83 ¯ ± ¯0.15 ¯ °C more than Tmax. A similar analysis demonstrates that the effect is more pronounced during the colder months from November April than during the warmer ones from May to October. A comparison versus China urbanization records demonstrates that the regions characterized by a large Tmin-Tmax divergence are also the most densely populated ones, such as north-east China, that have experienced a diffused and fast urbanization since the 1940s. The results are significant and may indicate the presence of a substantial uncorrected urbanization bias in the Chinese climate records. Under the hypothesis that Tmax is a better metric for studying climatic changes than Tmean or Tmin, we conclude that about 50% of the recorded warming of China since the 1940s could be due to uncorrected urbanization bias. In addition, we also find that the Tmax record from May to October over China shows the 1940s and the 2000s equally warm, in contrast to the 1 ¯ °C warming predicted by the CMIP5 models.
Joanne Novo provided some of the paper's figures in her blog post here which as shown below.
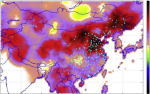
Figure 6 of the paper is a map of the temperature divergence between Tmin and Tmax.

Fig. 6. Map of the divergence (ΔTMin ˆ’ ΔTMax) between the warmings registered by the minimum and maximum temperature records (CRU TS4) between 1945 and 1954 and 2005 2014. The cyan dots indicate the 200 most populated cities in China according to the Free World City Database. (White regions over India and the ocean indicate missing data).
China is an excellent location to study the UHI effect. The population was 75% rural in 1955. Now it 's approaching 60% urban. The authors discovered the regions that warmed the fastest were also the largest population centers. The research duo looked at the minima, the maxima, the seasonal and monthly patterns, and in pretty much every case, the warmth follows the same pattern we 'd expect if it was caused by human industry. The minimums rose more than the maximums. The biggest warming effect comes in the coolest part of the day and in the coolest half of the year and it 's a toss up whether China has even warmed at all since 1940. The nights are hotter, but the days are colder than they used to be.
The Climate models (CMIP5) have barely any ability to predict future maxima and minima

Fig. 5. (Left) Tmax and (Right) Tmin. The maps show the 2005 2014 mean value minus 1945 1954 mean value. (top) Temperature observations (CRU TS4) and (bottom) full CMIP5 GCM mean ensemble simulation. The maps are centered over China. The hatching represents areas where the signal is smaller than one standard deviation of natural variability (e.g. the value is nearly zero).
Compare the models to the measurements:

REFERENCE
Nicola Scafetta, Shenghui Ouyang: Detection of UHI bias in China climate network using Tmin and Tmax surface temperature divergence. Global and Planetary Change, Volume 181, October 2019, 102989. https://www.sciencedirect.com/science/article/pii/S092181811930102X
Altertative link