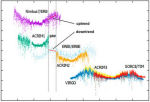
A new paper, Scafetta et al 2019, reviews the controversy regarding how the total solar irradiance (TSI) has evolved since 1978. One group of scientists believes the TSI slightly decreased from 1980 to 2000 while another group believes the TSI increased. A set of seven satellites monitored TSI over various periods from 1978 to date with different precision. Three ACRIM satellites recorded high quality data in the period 1980-2013, but there was a gap between the ACRIM 1 and ACRIM 2 satellite caused by the delay of launching ACRIM 2 due to the Space Shuttle Challenger disaster. The satellites give precise data of TSI changes but the absolute value of the TSI is very uncertain. The abstract says The main question is whether TSI increased or decreased during the so-called ACRIM-gap period from 1989 to 1992. Two other satellites recorded data over the ACRIM-gap, but their measurements were far less precise with one indicating increasing TSI and one, which was called ERBE, indicating decreasing TSI over the gap.
The study reviews three recent proxy models of TSI that show no change over the ACRIM-gap. These models agree with the TSI data only from 1996 to 2016, but they significantly diverge from the data from 1981 to 1996. By adjusting the TSI proxy models to agree with the data patterns the models the authors found the models miss a slowly varying TSI component. The abstract says The adjusted models suggest that the quiet solar luminosity increased from the 1986 to the 1996 TSI minimum by about 0.45 W/m2 reaching a peak near 2000 and decreased by about 0.15 W/m2 from the 1996 to the 2008 TSI cycle minimum. This pattern is found to be compatible with the ACRIM TSI composite and confirms the ACRIM TSI increasing trend from 1980 to 2000, followed by a long-term decreasing trend since. The downward ERBE trend over the ACRIM-gap was caused by well-documented degradation of its sensors that were experiencing their first exposure to the high UV radiation levels characteristic of solar activity maxima.
The Kitt Peak National Solar Observatory solar magnetic field strength (SMFS) trends upward during the ACRIM-gap which corresponds to an upward TSI trend. The rising solar activity revealed in the ACRIM TSI composite would be the primary driver for the global warming observed during the last decades of the 20th century. The results suggest that 2000 2002 could have been a grand solar maximum. The paper says that the multi-decadal solar activity oscillations could be interpreted and reconstructed by using the astronomical resonance of the solar system. The 2000 2002 TSI peak might have been caused by the maximum of the gravitational pull of Jupiter and Saturn on the sun that reached its 60-year cycle maximum around 2000.
Read the full paper "Modeling Quiet Solar Luminosity Variability from TSI Satellite Measurements and Proxy Models during 1980 2018", N. Scafetta et al, 2019, Remote Sensing, Vol. 11, Issue 21. https://www.mdpi.com/2072-4292/11/21/2569/htm