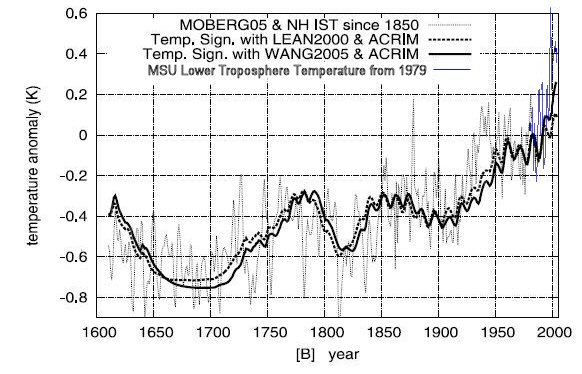
Northern Hemisphere Temperature vs Solar Irradiance 400 years

The graph shows a correlation between the solar irradiance and the Northern Hemisphere temperatures since 1600. The temperatures to 1850 were derived from proxy records. The temperature curve is from surface temperature record from 1850 to 1980, and from satellite lower troposphere record from 1980. The surface temperature record is contaminated by the effects of urban development. Black soot aerosols have contributed to a portion of the recent warming. Two solar irradiance proxy reconstructions are shown.
Note the low solar activity periods occurring during the Maunder Minimum (1645–1715, the Little Ice Age) and during the Dalton Minimum (1795–1825).
The graph shows that changes in solar activity are the primary cause of climate change.
©2002-2024 Friends of Science Society
