Climate Models Fail to Match Recent Temperature History
by Ken Gregory August 26, 2013
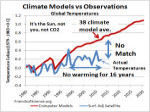
A team of prominent climatologists finds that the continued global warming stagnation over fifteen years, from 1998 to 2012, is no longer consistent with model projections at 98% certainty. Natural climate variations cannot explain the lack of warming if the climate is as sensitive to greenhouse gas emissions as is assumed in the models.

The above graph compares the average projection of 38 climate models prepared for the Intergovernmental Panel on Climate Change (IPCC) fifth assessment report to recent global surface temperatures.
Climate models utilized by the IPCC assume that most of the warming of the last half of the 20th century was caused by human-caused greenhouse gas emissions. They assume natural causes of climate change are insignificant, even though accurate ice core data shows that temperatures in the past have changed up to 24 times faster than the 20th century warming as shown in the graph below.

A team of German scientists from the Institute for Coastal Research and the Max-Planck-Institute for Meteorology, compared global warming trends to predicted warming trends computed by 23 climate models. The paper here says there has been no surface warming from 1998 to 2012 based on several global datasets. The lack of warming is inconsistent with the climate models at a 2% confidence level. This means there is a 98% chance that the climate models overestimate the warming effects of carbon dioxide (CO2) emissions and underestimate natural causes of climate change.
The climate scientists say there are three possible reasons for the climate model's failure:
1) the models underestimate the internal natural climate variability;
2) the models fail to include important external forcing processes; and
3) the model sensitivity to greenhouse gas emissions is too high.
The only way to make climate models match the global temperature record is to add the solar magnetic effects on cloud cover and greatly reduce the sensitivity to greenhouse gases. Numerous studies show strong correlations of solar magnetic flux to temperatures.
The models generally match the global warming trends from 1975 to 1998, but falsely simulate warming during the 1945 to 1975 cooling period which led to the great cooling scare of the 1970s. The models also underestimate the early 20th century warming from 1910 to 1945 by a factor of 4.5 because the amount of CO2 emissions was much too low to cause significant warming and the models do not include natural causes of climate change. The solar magnetic flux doubled from 1900 to 1991 as shown in the graph below, from Svalgaard and Cliver (2010).

The warming from 1980 to 1998 was not global; actual temperature declined over most of Antarctica and the southern oceans. A graph of the northern and southern sea surface temperatures is shown below.

The models are oversensitive to CO2 because they falsely assume that upper atmosphere water vapor, the most important greenhouse gas, would increase with warming, while measurements show it declines, allowing heat to escape to space. The modeled warming trend since 1979 in the tropical mid-troposphere is four times greater than measurements. The huge discrepancy is due to a decline in upper troposphere water vapor. The graph below was adapted from a graph published by Dr. Roy Spencer.

Dr. Spencer writes, "I frankly don’t see how the IPCC can keep claiming that the models are “not inconsistent with” the observations. Any sane person can see otherwise. Hundreds of millions of dollars that have gone into the expensive climate modelling enterprise has all but destroyed governmental funding of research into natural sources of climate change. For years the modelers have maintained that there is no such thing as natural climate change…yet they now, ironically, have to invoke natural climate forces to explain why surface warming has essentially stopped in the last 15 years!" here.
The recent low solar activity may cause significant cooling during the next few decades. Most datasets show cooling over the last 10 years and solar scientists expect the next few solar cycles to be weak.
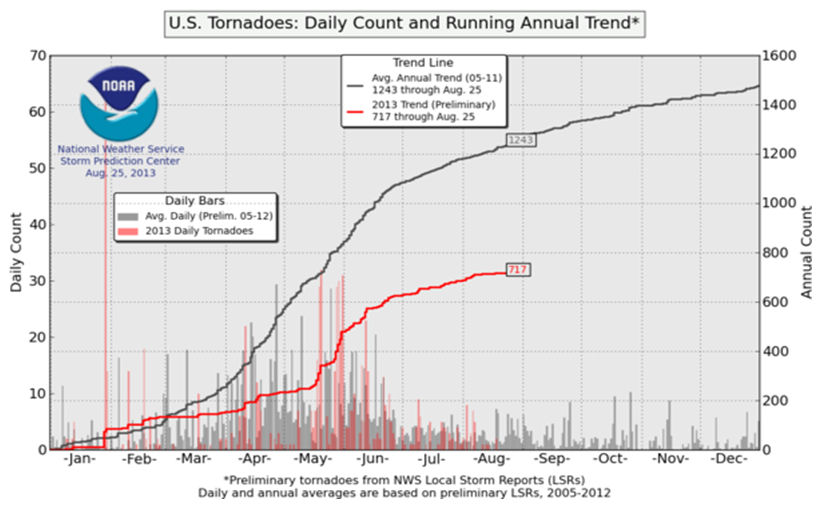
Many alarmists now claim that severe weather will get worst, directly contradicting measurements. The tornado count in the US year-to-date in 2013 is only 58% of normal (2005 to 2012 average) according to the NOAA graph below.
The global hurricane energy and frequency have declined significantly since 1998. In fact, only 3 hurricanes have made landfall in the USA during president Obama's 5-years presidency, the fewest of any president. In contrast, 26 hurricanes made landfall during the presidency of Grover Cleveland when CO2 level were low.

The graph above shows the global and northern hemisphere 24-month accumulated cyclone energy. The graph below shows the frequency of tropical storms and hurricanes. Both graphs were compiled by Dr. Ryan N. Maue.

The global warming climate scare promoted by the IPCC and activists has resulted in the expenditure of over $1.6 trillion dollars worldwide in a futile attempt to control greenhouse gas emissions.
Wind and solar power are being abandoned in Europe because it is causing heat-or-eat poverty and occasional blackouts. Electricity costs in Europe are about 40% higher than in the United States due to European alternative energy policies.