September 25, 2025 – 7 PM, Calgary, Alberta
Presented by Joseph Fournier
Ticket sales are ongoing until September 25th, while supplies last. No tickets will be sold at the door. The event will also be live-streamed.
 We are pleased to announce the release of Energy & Climate at a Glance: Canadian Edition. This 88-page book, published by Canadians for Sensible Climate Policy (CSCP) and The Heartland Institute, is a timely counter to the “Net Zero” push, and outlines how that goal is unachievable by 2050, scientifically unnecessary, and will ensure lower standards of living with no appreciable environmental benefit.
 The book’s lead authors are Ron Davison, P.Eng., president of The Friends of Science Society, and H. Sterling Burnett, Ph.D., of The Heartland Institute.
Purchase Your Copy Today
It is common to hear alarming statements about climate change and calls to reduce CO2.
We invite you to explore with us our Climate Essay to review some of the context behind that alarm, the objective facts and the motivators which have transformed this scientific topic into a political one.
Climate Change 101 also provides similar context but with a less scientific style.
The Library is a repository of all we have on Climate and it's designed for everyone to easily find what they need.


Politics doesn't have to take the driver's seat on this issue. We have compiled materials for everyone, bringing together thousands of peer reviewed journal articles, essays, books, charts, links, videos and presentations for you to explore and discover new aspects of these issues.


This short video will show you how to make the most of our website resources and how to use the search tools.

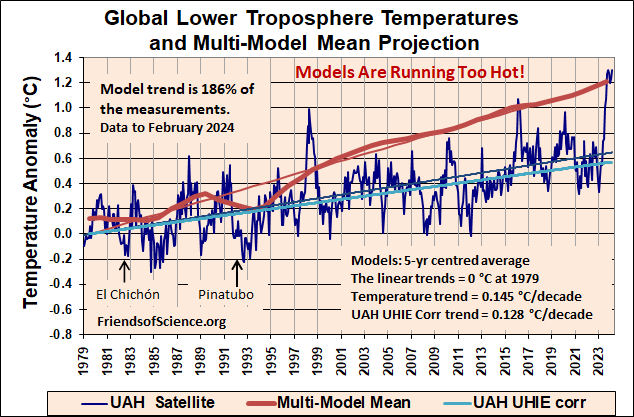
This graph presents the lower troposphere temperature changes from surface up to about 8 km as determined by the University of Alabama in Huntsville (UAH) satellite data. Click here for a larger image.
The best fit line from January 1979 to August 2025 indicates a trend of 0.16 °C/decade. The dark red line is the 5-year centered average of lower troposphere climate models. The model trend clearly demonstrates that models are over predicting and “running hot” with a prediction of 174% of observed measured temperatures. The UAH UHIE corr (light blue) line is the Urban Heat Island Effect corrected trend based on this study.
The sharp temperature spikes in 1998, 2010, 2016 and 2023 are El Niño events. The Happa Tonga-Hunga Haʻapai underwater volcano also contributed to the high temperatures from 2023 to 2025 by the ejection of a large volume of water vapour that increased the concentration in the stratosphere by about 10%.
The sun's activity, which has increased through most of the 20th century, reached a magnetic flux peak in 1992 and has since declined. The sun's temperature response is delayed by a few decades after the sun's peak intensity due to the huge heat capacity of the oceans.

Some great online learning resources on the topic of climate science.


Friends of Science Society is powered by volunteers and organizational engagement. Please take a moment to consider a contribution, joining or working to spread the word. Only with your help can we succeed in our mission.


