
By: Ken Gregory, BASc.
CliSci # 442 2025-12-07
Canada Summer Daily High Temperature Trends, 1900-2023
Dr. Roy Spencer did an analysis of daily high summer temperatures of the six large Canadian provinces using the daily Global Historical Climate Network (GHCNd) dataset. Spencer wrote “Given media reports, it is likely that most Canadians think they have been experiencing unprecedented summer warmth in the last couple of decades. But this isn’t true.” He averaged the monthly average daily maximum temperatures (Tmax) of the warmest 3 days in each month, and average of the coolest 3 days in each month) from all available stations. He also performed an elevation correction for each station using a lapse rate of 6.5 °C per km. In all provinces the number of stations increases from 1900 to the 1970s, then decreases substantially in recent years.
The results are;
- The average summer (June, July, August) daily Tmax of the six provinces show no trend (0.00 °C/decade) over the period 1900-2023.
- The average of the 3 hottest days’ Tmax in each month show a slight downward trend (-0.02 °C/decade), while the 3 coolest Tmax per month shows a slight upward trend (0.03 °C/decade).
- Seven of the ten hottest summers occurring in the 1930s.
The Canada 6-province Tmax plot is shown below. There has been a slight cooling since the 1940s and a slight warming since 2000. Spencer’s post also show plots of station counts and Tmax temperatures of each of the six provinces. In Albera, the summer temperature trend 1900-2023 of the warmest 3 days each month is −0.05 °C/decade, indicating a slight cooling.

A Presentation by Ross McKitrick to the Committee on Environment and Sustainable Development About Canada’s Emissions-Reduction Plan.
Dr. Ross McKitrick made a presentation via video link to the Canadian House of Commons Committee on Environment and Sustainable Development regarding Canada's 2030 Emission Reduction Plan on October 20, 2025. He wrote on his website “My remarks made some very simple points about drivers of emissions (and why we won't meet the Paris target) and the costs of different approaches to emission reductions.”
In his written submission, McKitrick notes that unlike earlier periods (e.g., when Canada confronted the Kyoto Protocol), the current federal government has not published any detailed, official cost estimates for its emissions-reduction plan (ERP). Agencies that previously provided modeling (e.g., Finance Canada, Natural Resources Canada) have not re-constituted their modeling group, leaving a lack of transparent, publicly available analysis. Using his own updated computable GE model, McKitrick estimates that if the full ERP were implemented, Canada would achieve “a little over halfway” toward the 2030 GHG target — but at an economic cost of roughly 6% of Canada’s GDP. Under that scenario, GDP would still grow, but more slowly (e.g., ~1.8 % per year instead of ~2.4 %).
According to McKitrick, the carbon price (tax or price on emissions) is by far the cheapest and most effective tool: by 2030 it would cut emissions by about 18% (vs. 2019 levels), with only a minimal drag on GDP growth (~0.1% per year). By contrast, other measures in the plan — such as stricter building-energy codes, electric-vehicle (EV) mandates, Clean Fuels Regulation, and other regulations — would impose about three times the cost on the economy while contributing only around one-tenth of the emissions reduction that the carbon price would. McKitrick notes that emissions intensity has fallen ~ 40% since 2005 (about –2% per year), primarily through long-term technological and energy-efficiency improvements.
Climate Change and Economic Growth: Evidence from Local Income Proxies
The authors of this paper address a core challenge in climate-economy research: the spatial mismatch between climate data (which is often highly local) and economic data (often aggregated at national level). Many previous studies average climate data across entire countries or population-weight grids, which can obscure local variation and lead to misleading inferences. To overcome that, they build two novel global datasets measuring local economic activity over time using air-traffic data and satellite night-lights data. These serve as proxies for local income/output and allow matching with local climate variables, avoiding ad hoc spatial averaging. The goal is to determine if climate change (especially temperature) permanently affects income growth, not just income levels.
The authors find that in simple plots (income vs. temperature) income tends to increase with temperature up to a point (peak around ~10 °C), then decline for hotter gridcells. However, once they include a full set of explanatory variables (fixed effects, lagged income, regional/national GDP, etc.), the positive or negative effects of temperature on income become much smaller, often statistically insignificant — especially in richer regions. This suggests that prior results showing large climate-income effects may have over-stated them due to aggregation and omitted variable bias. Their main conclusion: climate change (warming) does not have a permanent effect on income growth rates. Warming might shift the level of income up or down depending on region and baseline climate, but it does not fundamentally alter the trend of growth over time.
Extinction Rates Have Slowed across Many Plant and Animal Groups
A new study by scientists with the University of Arizona revealed that over the last 500 years extinctions in plants, arthropods and land vertebrates peaked about 100 years ago and have declined since then. The news release about the study says that “the researchers found that the past extinctions were mostly caused by invasive species on islands and are not the most important current threat, which is the destruction of natural habitats. The paper argues that claims of a current mass extinction may rest on shaky assumptions when projecting data from past extinctions into the future, ignoring differences in factors driving extinctions in the past, the present and the future.”
The authors analyzed rates and patterns of recent extinctions across 912 species of plants and animals that went extinct over the past 500 years. The causes of those extinctions are very different from the threats species are currently facing. Past extinctions are unreliable predictors of the current risk that species face. Habitat loss was the most important cause (and current threat) in continental regions. Many species appeared to go extinct on islands because of predators and competitors brought by humans, such as rats, pigs and goats. The researchers found that there was no evidence for increasing extinction from climate change. Extinction rates have actually declined over the last 100 years. Biodiversity generally increases in warmer climates (e.g., in the tropics). This is attributed to factors like higher primary productivity, faster evolutionary rates, and more stable climates over evolutionary time. The increasing CO2 fertilization is causing is increasing shrub cover in hot, arid regions. Some animals can use the increase shade from the shrub cover to more easily migrate.
IEA Publishes Climate Era’s Obituary
The International Energy Agency (IEA) published the “World Energy Outlook 2025” (WEO2025) which “reads like an obituary for the fantasy of global decarbonization, acknowledging the undeniable truth that nations prioritizing prosperity must unapologetically embrace coal, oil and natural gas.” This is the opinion of Vijay Jayaraj, who wrote that “The end is nigh – not for the world, but for the climate industrial complex. It has been a decline brought about mainly by the sheer reality of energy economics in the developing world.” Many environmental organizations had predicted a dramatic drop in demand for hydrocarbon after 2030. The IEA concedes that demand for oil and natural gas will continue to grow well beyond 2035 and may not peak until 2050. Jayaraj wrote “The key insight of the IEA report is that emerging markets, excluding China, are becoming the primary drivers of growth in global energy consumption.” India’s oil use is projected to increase by 45% and coal use by 60% from 2024 to 2035. Indonesia’s need for industrial coal is expected to increase by more than 45% over the same period. India’s and Indonesia’s per capita electricity demand are to grow by 80% and 70%, respectively, by 2035. These surges are driven by air conditioning, appliances, urbanization and relentless population growth.
The WEO2025 presents four energy use scenarios. Two of these set starting conditions and then examine where they lead. The Current Policies Scenario (CPS) considers a snapshot of policies and regulations that are already in place. Demand for oil rises by 11% from 2024 to 2050. Coal demand drops by 7% by 2035 and by 22% by 2050. Global natural gas demand rises 31% from 2024 to 2050.
The Stated Policies Scenario (SPS) considers the application of a broader range of policies, including those that have been formally put forward but not yet adopted. Oil demand peaks at around 2030 before gradually declining. Coal demand drops 20% from 2024 by 2035. Natural gas demand remains almost constant to 2050.
Two scenarios presented are unrealistic. The Net Zero Scenario assumes CO2 emissions are reduced by 55% from 2024 levels by 2035 and to net zero by 2050. The ACCESS Scenario is a roadmap for universal energy access to electricity and clean cooking.
CliSci # 441 2025-11-19
China’s Green Energy ‘Revolution’ Is Powered by Coal
Bjorn Lomborg, the president of the Copenhagen Consensus published an article in the Wall Street Journal that reports China’s dominance in green energy is powered by coal production. China is producing enough solar panels, wind turbines, electric vehicles and batteries to flood global markets. Lomborg wrote “In reality, the country has dramatically scaled up energy use across the board—buoying ‘green’ manufacturing with coal expansion—and grown rich in the process.”
“China supplied 39% of the $2 trillion that the world invested in green energy last year. Chinese money has been flowing into solar panels, creating overproduction and overcapacity. Chinese annual solar production capacity is now more than twice the actual global solar-panel sales in 2024. The International Energy Agency (IEA) studied Chinese energy firms and found that every segment of the Chinese solar supply chain suffered profit losses in every quarter last year, with margins reaching almost as low as minus 60%. Between the start of 2024 and July 2025, more than 40 companies delisted, went bankrupt or were sold. Every Chinese silicon smelter, an essential solar-panel material, requires its own coal-fired power station.
Investment is also pouring into electric cars. Overcapacity is staggering: The consultancy AlixPartners estimates that of the 129 current Chinese EV and hybrid brands only 15 will be financially viable by 2030. Chinese consumers buy nearly two-thirds of all EVs sold globally—pushed by government limits on traditional car purchases and lured by rock-bottom prices from surplus production. EV battery packs are made using coal energy and charged on a coal-dominated grid. A 2023 estimate published in iScience shows that over its lifetime a Chinese EV emits 85% to 90% of the carbon of a gasoline car, in large part because of the heavy carbon debt incurred by the coal-produced battery. And this may be too optimistic, as many new buyers would otherwise have bought no car or a less-polluting hybrid. China remains the world’s top coal consumer, with fossils supplying over 87% of its primary energy. Internation Energy Agency data show China in 2023 added more than five times as much coal energy as solar and wind energy.”
When Climate Modeling Becomes Climate Mythmaking: “Sea-Level Rise Causes More Cold Snaps”
Charles Rotter wrote this article that mocks a paper recently published in Nature Communications that attempts to link sea-level rise — in the tiny range of 15 to 30 cm — to an increase in extreme cold outbreaks in East Asia. The paper’s abstract says “Here, we focus on East Asia and conduct climate model experiments to investigate the effects of GMSL rise on winter cold extremes. Our experiments demonstrate that GMSL rise promotes stronger and more frequent extreme cold events, and this influence is expected to strengthen significantly in the coming century. This effect is attributed to weakened mid-high latitude westerly winds and increased occurrence of blocking events over Eurasia.”
Rotter wrote “To reach this conclusion, the authors construct a world that doesn’t exist, run simulations for thousands of virtual years, and then present the resulting patterns as evidence for a new climate threat. It reads less like a scientific study and more like a technocratic fable: Once upon a time, a uniform global ocean rose an identical number of centimeters everywhere, and then the atmosphere obediently rearranged itself to produce additional cold spells.”
The premise rests on the assumption that “even a slight, globally uniform sea-level rise can notably impact atmospheric and oceanic circulations at climatic and potentially synoptic scales.” That line alone deserves an award for imaginative framing. A globally uniform sea-level rise exists in climate models, but nowhere on Earth. The oceans are not a swimming pool; they are a dynamic, sloshing fluid influenced by gravity anomalies, tectonics, heat transport, winds, freshwater fluxes, and basin geometry. Treating them as a flattened bathtub surface is the kind of abstraction that may simplify a model but certainly does not simplify reality.
The paper says “All experiments were run for 2200 model years, with analyses focusing on the last 200 years of the model output.”, and “Our coupled sea-level experiments have been conducted over a span of 2200 years, a duration sufficient to induce substantial warming in the North Pacific.”
This is equivalent to admitting that the model has been allowed to drift into a condition that Earth has not experienced — and then treating the drift as a feature rather than a flaw. When a long simulation produces substantial warming in a specific region simply because it was allowed to run long enough, that warming is not a discovery; it’s a numerical artifact. Yet this artifact becomes the scaffolding for the claim that sea-level rise “intensifies extreme cold events.”
The paper freezes atmospheric CO2 concentration at 400 ppm for every simulation, even when sea-level rise is pushed to absurd levels (5, 10, 20 meters). This creates a physical impossibility. If sea level rises by 5 to 20 meters — a scale associated with glacial melt over millennia — CO2 would not be holding still at 400 ppm. The authors admit that in a world where sea level rises beyond about 2.5 meters, rising CO2 and its warming effects would overwhelm their hypothesized cold-event mechanism. One of the more creative parts of the study is the claim that raising sea level weakens Eurasian mid-latitude westerlies, strengthening blocking events that funnel cold Arctic air into East Asia. The authors decorate the output with t-tests, regressions, and confidence levels pulled from a dataset that exists only inside a computer. The result is presented as a threat requiring urgent assessment. The bridge constructed between sea level rise and cold snaps in East Asia is as artificial as the uniform ocean surface the authors command into existence with their model code.
2025 Hurricane Forecast Was Overly Alarmist (Again)…Atlantic Season Ending Near Normal
The US National Oceanic and Atmospheric Administration (NOAA) predicted an above average Atlantic hurricane season for 2025. NOAA’s outlook for the 2025 Atlantic hurricane season, which goes from June 1 to November 30, predicted a 60% chance of an above-normal season, and a 10% chance of a below-normal season. The agency forecast a range of 13 to 19 total named storms (winds of 39 mph or higher). Of those, 6-10 were forecast to become hurricanes (winds of 74 mph or higher), including 3-5 major hurricanes (category 3, 4 or 5; with winds of 111 mph or higher). Pierre Gosselin wrote “Now that the season is winding down, we are able to start concluding and summarizing the season: it’s going to come in as near normal activity.” In fact, there were only 5 hurricanes in the current season which is much less than the forecast 6-10 hurricanes. The forecast of major hurricanes was accurate.
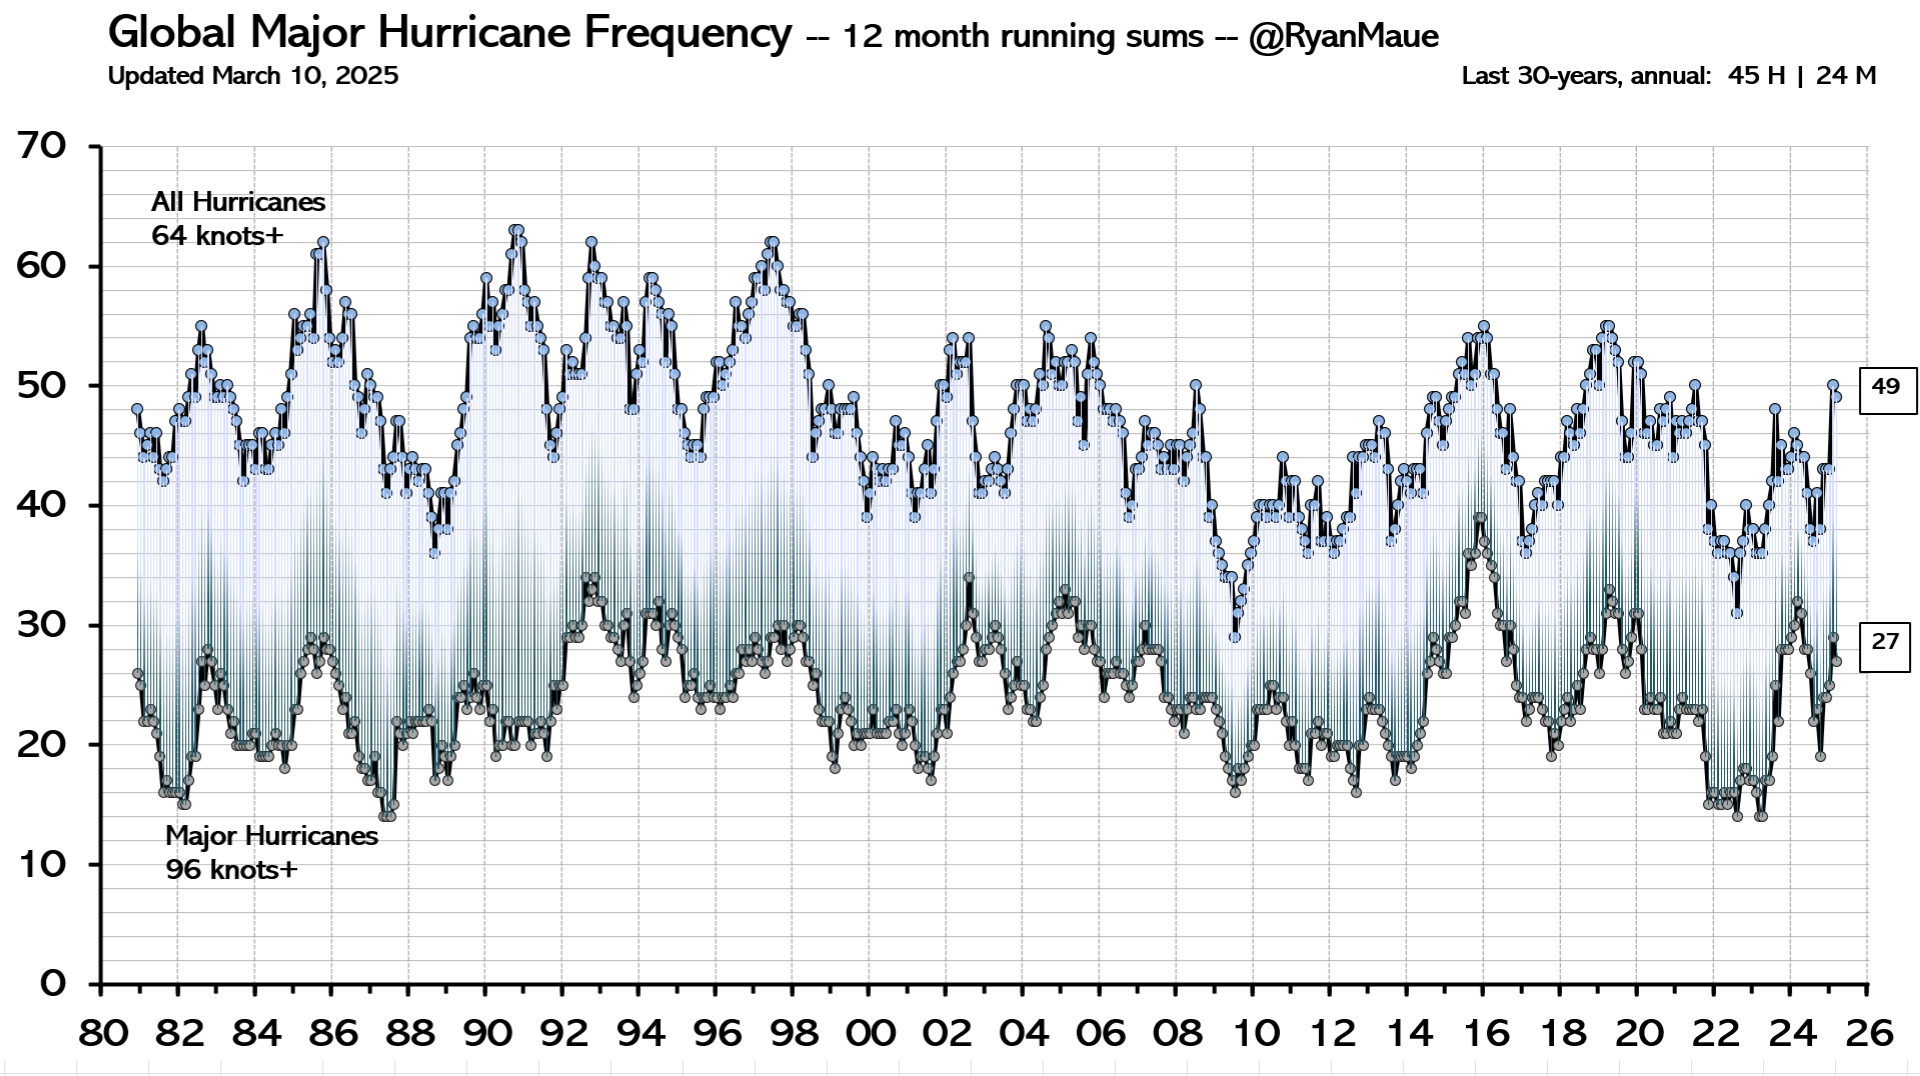
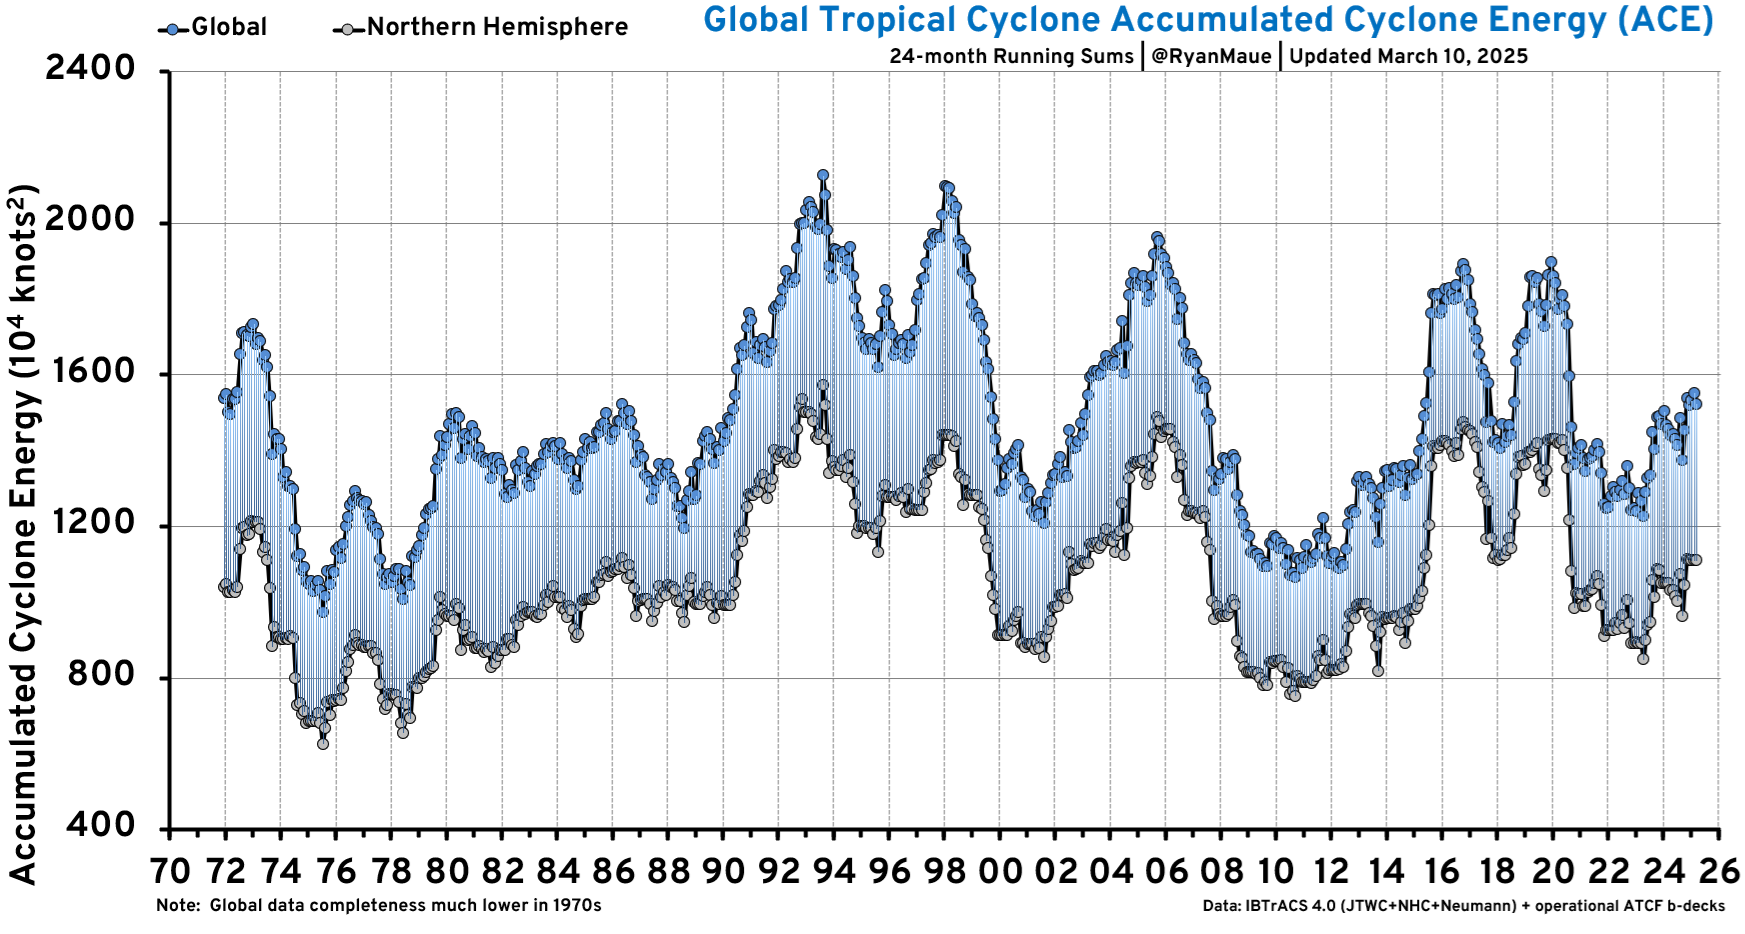
Alarmists have claimed tropical storm activity would increase with global warming. Though the globe has warmed over the past 50 years, global cyclone activity has not escalated as feared. According to the University of Colorado, the accumulated cyclone energy (ACE) of the North Atlantic hurricane season as of November 17, 2025 was 132.6, only 10.8% higher than the 1991 to 2020 average of 119.7. The ACE integrates hurricane frequency and intensity. Currently there are no signs of tropical storms in the Atlantic. Furthermore, the global frequency trends of both all hurricanes (wind speeds > 74 mph) and major hurricanes (wind speeds > 111 mph) from 1990 to October, 2025 has been downward. The 24-month running sum of the global ACE from 1972 to October, 2025 shows variability but no significant trend, but the trend from 1990 is downwards.
Bill Gates; Climate Disaster Isn’t Imminent
Bill Gates has recently changed his alarmist tune on climate change. He wrote “Climate change is serious, but we’ve made great progress. It’s time to put human welfare at the center of our climate strategies, which includes reducing the Green Premium to zero and improving agriculture and health in poor countries. Although climate change will have serious consequences—particularly for people in the poorest countries—it will not lead to humanity’s demise. People will be able to live and thrive in most places on Earth for the foreseeable future.”
Gates said that rather than focus on temperature as the best measure of progress, climate resilience would be better built by strengthening health and prosperity, particularly in vulnerable regions. Gates correctly points out that cold — not heat — is a far greater threat to humanity, writing, “excessive cold is far deadlier, killing nearly ten times more people every year than heat does.” Gates said “pressure pushed by wealthy shareholders to cease the financing of fossil fuel projects in impoverished but resource-rich nations has had almost no impact on global emissions. But it has made it harder for low-income countries to get low-interest loans for power plants that would bring reliable electricity to their homes, schools, and health clinics.”
Ontario’s IWT, Solar & BESS to Throw $200 Million Away in November
Parker Gallant examined Ontario’s Independent Electricity System Operator (IESO) data for several days of November and said that “Ontario ratepayers/taxpayers are simply watching our money go down the drain!” The IESO of Ontario has subsidized electricity contracts with industrial wind turbines (IWT), solar panels and battery storage owners. Gallant wrote “The reason the money went ‘down the drain’ was, we Ontario ratepayers didn’t need the generation, but those IWT contracts give them ‘first-to-the-grid’ rights, so IESO were busy selling most of it off to our intertie neighbours with Quebec, New York and Michigan buying most of it for a fraction of its costs to us Ontarians!”
On November 3, the IWT generated a total of 94,867 MWh, which was 80.1% of their rated capacity. Most of that power wasn’t needed so the IESO sold 81% of the IWT generation to its neighbours. The net exports for the day were 75,766 MWh. The IWT owners were paid $151/MWh for the 94,867 MWh, so the total cost of their generation was $14,325,000. Unfortunately, the sale price only averaged $53.30/MWh so the net exports only earned about $4,038,000 bringing the net costs to Ontario ratepayers/taxpayers to almost $10.3 Million! The net consumption of wind power of 9,101 MWh the Ontario ratepayers consumed cost them the high price of $538.54/MWh, or 53.9 cents per kilowatt-hour.
The net cost of over-generation of IWT energy that was surplus to Ontario’s needs of 12 days in November (Nov. 3,4,5,8-16) was $74.9 million. This is the cost of generation paid to the IWT owners less the sales revenue of the power delivered to Ontario’s neighbours. The net wind power consumed in Ontario was 220,204 MWh, so the average cost of the power, net of power sales, was $340/MWh, or 34 ¢/kWh. For comparison, the electricity rate for a current one-year fixed rate electricity plan in Calgary, Alberta is about 7.6 ¢/kWh.
Industrial solar energy and battery energy storage system (BESS) are Ontario’s most expensive energy sources. Solar generators are paid $440/MWh. BESS are paid $672/MWh for 250 calendar day annually regardless of whether they do or don’t disburse any stored power! In the five days of November 8 to 12, the grid connected solar panels only generated 1,619 MWh which cost $712,000. The BESS units delivered 5,761 MWh costing $3,873,000. Hydro or natural gas plants could have easily provided that energy at much lower costs.
Correction: CliSci # 440
A few people noted a typo in the previous CliSci # 440, item “Politico's Failed Attack ...”, Part 1, paragraph 5 says " ... risk of dying decreased by 99.4% from 2020's to 2020's ...". The date range should be “from 1920's to 2020's ...". It was corrected on the website version.
CliSci # 440 2025-10-31
Climate Change to Make More Rain in the Sahara Desert
A new paper claims that climate change will cause more precipitation in the Sahara Desert and the Sub-Sahara region of Africa. An article from the University of Illinois Chicago says “by the second half of the 21st century, rising global temperatures could make the Sahara much wetter, according to UIC researchers. By that time, the North African desert could see 75% more precipitation than its historical norm.” The authors investigated “the drivers of projected summer precipitation changes and their uncertainties across Africa in the second half of the 21st century under the SSP2-4.5 and SSP5-8.5 scenarios using CMIP6 models.” Rainfall is expected to increase by 25% in southeastern Africa and by 17% in south-central Africa. Anthony Watts commented “Of course, it’s another climate model [study], so take it with a grain of salt.” The SSP5-8.5 scenario is an extreme CO2 emissions scenario which requires 6.5 times more coal use in 2100 than in 2010. The researchers also expect the southwestern region of Africa to be drier, with a 5% decline in precipitation. Overall, this is good news. But the lead author says “We have to start planning to face these changes, from flood management to drought-resistant crops.” Well, increasing CO2 makes crops more drought resistant!
The paper doesn’t show the full range of forecasts so I produced a graph from climate explorer of precipitation forecast of a selection of computer models using the SSP-7.0 scenario as well as the actual precipitation from the U.K. Climate Research Unit (CRU) of the sub-Sahara region from 5° to 15°N. The graph shows that the computer models’ precipitation rates have a huge range of values and rates of precipitation change. In 2023, the last year of the actual data, the climate model’s precipitation ranges from 1.39 mm/day to 3.87 mm/day. The high rate is 280% of the low rate. The CRU measured 2023 rate was 2.7 mm/day. The best fit slope of the 30 available precipitation forecasts from 2023 to 2100 ranges from decreasing at -0.018 mm/day/decade to increasing at 0.148 mm/day/decade. The graph below shows 16 of the 30 available climate model projections.

Politico’s Failed Attack on DOE’s Climate Science Report
Part 1
Politico recently published an article that criticizes the authors —John Christy, Judith Curry, Steve Koonin, Ross McKitrick, and Roy Spencer—of the U.S. Department of Energy’s (DOE) July 2025 climate report on the impacts of greenhouse gas emissions. Marlo Lewis, Ph.D., of the Competitive Enterprise Institute, wrote a 2-part rebuttal of the Politico article. The rebuttal shows that “its criticisms of the DOE report repeatedly misfire or backfire, and none comes close to refuting any of the report’s conclusions.”
Part 1 of the rebuttal shows that mainstream climate research usually runs overheated models with inflated emission scenarios and ignore or depreciate humanity’s remarkable capacity for adaptation. All three biases compromise the major assessment reports informing the 2009 Endangerment Finding which claims greenhouse gas emissions endanger public health or welfare. A graph of climate model warming projections in the tropical mid-troposphere shows that, on average, the model’s warming exceeds the observed warming by a factor of 2.4 from 1979 to 2016. The mid-troposphere is uniquely suited for testing the validity of climate models because the models predict more warming there than at the surface, the region is well monitored by satellites and weather balloons, it is little influence by land use changes, and the models were not tuned to match this region.
The IPCC’s report claims the models are realistic because they reproduce the 20th century global warming of surface temperatures only when run with both natural and human-made GHG emissions. But this is false as it is circular reasoning. It assumes that all natural and non-GHG human caused warming has been estimated correctly. An AR5 chart, redrawn for clarity by John Christy, shows that model projections and observations almost entirely diverge throughout the troposphere unless the models are run with natural variability alone.
Lewis goes on the explain that the RCP8.5 and SSP5-8.5 emissions scenarios assumes that oil and natural gas become much more expensive and global coal consumption increase almost tenfold during 2000-2100. They are extremely high emission scenarios which have been widely misrepresented as business-as-usual. Lewis wrote “Google Scholar lists 51,900 papers on RCP8.5 and 15,500 on SSP5-8.5. … The climate fraternity’s decades-long embrace of extreme scenarios as business-as-usual is a scandal about which the Politico reporters say nothing.”
The Obama administration made a decision to treat adaptation as outside the scope of the endangerment finding. Excluding adaptation from the evaluation of economic impacts of climate change enormously increases the impact costs. The average person’s risk of dying from climate-related risks, extreme weather has decreased by 99.4% from the 1920’s to the 2020’s. Globally, climate-related economic losses as a percentage of exposed wealth declined almost five-fold from 1980-1989 to 2007-2016, with most of that progress occurring in low-to-middle income countries. Lewis concludes “Societies that protect economic liberty and welcome abundant energy may reasonably anticipate a future of increasing climate safety and diminishing relative impact of weather-related economic damage.”
Part 2
The Politico article “accuse the DOE report’s authors of cherry picking and omitting context”, and other imagined faults.” Lewis discusses the three accusations of cherry picking and shows that they are unfounded in Part 2 of the rebuttal. The DOE report says “the U.S. saw its most intense heat in the 1930s—and that maximum temperatures have never been that hot again.” This is true, but the Politico reporters call it cherry picking because U.S. temperatures have been rising since 1950. The DOE report also shows rising temperatures since 1950. Pointing out that temperatures were higher in the 1930’s isn’t cherry picking. Cherry picking requires leaving out part of the data to make a biased assessment. The DOE report authors didn’t do that.
The DOE Report features a graph of temperature trends by 36 climate models and measurements in the 12-state U.S. corn belt. It shows that all models predict far too much warming and 34 of the models projecting two to seven times more warming than occurred during 1973-2022. The Politico reporters called it cherry picking because other regions are experiencing “increases in extreme summer heat.” That is mostly in heavily urbanized regions which has substantial urban warming. Lewis wrote “It is only common sense to doubt the validity of climate models that cannot ‘predict’ what has already occurred.”
The third alleged cherry pick is the DOE authors’ selection “of which model simulations and which observations they show.” Lewis explains “DOE authors focus on model simulations of tropospheric temperatures because those data are out of sample and therefore suitable for scientific model testing. The DOE authors’ choice of simulations and observations is sound experimental design, not cherry picking.
The Politico reporters say that the DOE Report quotes one sentence in AR6 about hurricane intensity but not the next sentence. The quoted sentence says “There is low confidence in most reported long-term trends in tropical cyclone frequency or intensity …”. The omitted next sentence says “This should not be interpreted as implying that no physical (real) trends exist, …”. This statement cautions that absence of evidence is not evidence of absence, but this adds nothing to the substantive discussion of why trend detection is not “robust.” However, the very next sentence of the DOE report quotes the following sentence from AR6: “It is likely that the global proportion of major (Category 3–5) tropical cyclone occurrence has increased over the last four decades …” Lewis says “Thus, the DOE report does not hide anything or mislead anyone.”
The Politico reporters complained that the DOE Report didn’t say the hurricanes are “dropping more rain”. But short data records and substantial natural variability continue to impede robust detection of the “increasing destructiveness of tropical cyclones”. Lewis says “Most of the nation’s climate research is conducted at prestige universities where political groupthink and viewpoint intolerance continually imperil freedom of speech and thought.”
Environmental Damage Caused by Onshore Wind Turbines
A new paper published in Nature shows that the effect of utility-scale wind energy production “can be far reaching and sometimes have large and unexpected consequences for biodiversity”. The science team notes that turbines can kill birds, bats and insects, change animal behaviour, physiology and demography and alter ecosystems. A 2021 USA report on the potential pathways to Net Zero emissions is noted and this suggests using up to 13% of the land area for wind farms. It is estimated that 500,000 bats are killed onshore in the US by wind turbines every year. In the UK, 30,000 is the estimated annual kill number, with Canada at 50,000 and Germany at 200,000. Possible population collapse has been predicted for cinereous and griffon vultures in Europe and the Eurasian skylark in Portugal. Other predictions suggest population declines for hoary bats in North America, lesser kestrel in France and black harriers in South Africa. Finally, the authors report that the globally endangered Egyptian vulture in Spain has a lower survival rate, population growth rate and size in the presence of wind facilities.
CliSci # 439 2025-10-20
Death Valley Illusion: Evidence Against the 134 °F World Record
A new paper was published that debunks the world record temperature of 134 °F (56.7 °C) recorded at Greenland Ranch, Death Valley, California, on July 10, 1913. The authors, Roy Spencer, John Christy and William Reid, estimated the temperatures at the Greenland Ranch temperature station using the lapse rates between that station and several surrounding stations in July. The paper’s abstract says “Using July data from non-Death Valley stations during 1923 to 2024 we compute a range of temperature lapse rates diagnosed from the differences between Greenland Ranch station and the average of higher-elevation stations’ maximum temperatures and elevation. The range of lapse rates from those 102 years of July data are then used to estimate Greenland Ranch temperatures during the early years (1911-1922). The first two weeks of July 1913 are shown to be spuriously hot, and other years at Greenland Ranch exhibit anomalous July temperature behavior as well.” The authors believe that some reading from the temperature station were replaced with those taken from the veranda of a ranch-house by “a thermometer of unknown provenance” (possibly subject to direct sunlight). The authors “recommend that the 134 °F world record status be rescinded.” The world second highest temperature record is 131 °F (55 °C), which was measured in Kebili, Tunisia, on July 7, 1931.
California Shuts Down Its Solar Thermal Plant 13 Years Early
The Ivanpah Solar Power Facility is set to shut down in 2026 after failing to meet its energy targets. Ivanpah is located near the California-Nevada border, 65 miles southwest of Las Vegas. Despite receiving US$1.6 billion in federal loan guarantees, nearly 75% of the facility’s cost, it struggled to generate power and had to rely on natural gas to start operating each day and during cloud cover. The facility used up to 525 mmcf of natural gas per year. According to the Associated Press, if approved by regulators, the deal would lead to closing two of the plant’s three units in 2026, which is 13 year earlier than planned. The plant features three 140 m (459-foot) towers and 173,500 computer-controlled mirrors. Construction started in 2010 and was completed in 2014 at a cost of US$2.2 billion. The sun, when shining, heats water in the boiler’s tubes to make steam which drives turbines to generate electricity. Ivanpah was expected to generate 940 GWh of electrical energy per year. That energy level was never achieved as the plant proved to be inefficient and costly. Over the period 2014-2022 the facility produced an average annual electricity output of 714 GWh of which 687 GWh was from solar power, and 27 GWh from natural gas.
The power plant is responsible for at least 6,000 bird deaths per year. The birds can receive severe burns or become incinerated if they fly too close to the towers that concentrate sunlight from the solar panels.
Stability of the Atlantic Meridional Overturning Circulation Inferred by Subsidence-corrected Sea Level Change
The Atlantic Meridional Overturning Circulation (AMOC) influences sea level rise by redistributing ocean heat, which causes regional variations in sea level that differ from the global average. A weakening AMOC is projected by computer models to accelerate sea level rise along the U.S. East Coast, as a slower flow of warm water north means warmer, higher water levels pile up along the coast. The stability of the AMOC is a subject of intense scientific debate. Some computer models suggest that the AMOC may severely weaken in the future while other studies show AMOC stability. This paper uses the difference in sea level rise between New York, USA and Brest, France to show that the AMOC has been stable. The paper’s abstract says “This study highlights how sea level differences, corrected for subsidence, provide a robust and simple proxy for AMOC stability. A comparison of tide gauge data from The Battery, New York, and Brest, France, corrected for land subsidence using GPS measurements, reveals a negligible difference in absolute sea level rise between these locations, reinforcing the stability of the AMOC within the period 1960 to 2024.”
Continued Atlantic Overturning Circulation Even Under Climate Extremes
This paper published in February 2025 uses climate model simulations to “show that that the AMOC is resilient to extreme greenhouse gas and North Atlantic freshwater forcings across 34 climate models.” Persistent wind in the Southern Ocean caused upwelling, which must be balanced by downwelling in the southern Atlantic and Pacific oceans. The AMOC can collapse only if a compensating Pacific Meridional Overturning Circulation (PMOC) develops. In climate models only a weak PMOC emerges but it is too weak to balance the Southern Ocean upwelling. This suggests that an AMOC collapse in unlikely. The study reveals AMOC-stabilizing mechanisms that prevent an AMOC collapse this century.
Historical CO₂ Levels in Periods of Global Greening
Increasing CO2 levels is the primary driver of global greening which has caused a 30% increase in global gross primary production (GPP). Approximately 70% of the GPP increase since 1980 was caused by increasing CO2 levels. CO₂ is a primary raw material for photosynthesis, so higher availability allows plants to grow faster and often use water more efficiently (by reducing stomatal conductance). Many studies have found that the fertilization effect is weakening and greening is slowing down. This paper evaluates whether CO₂ levels during historical periods of similar or more greenness as today, are consistent with CO₂ levels remained below 300 ppm over the past 800,000 years, as indicated by Antarctic ice core records. The present level of greenness in terms of GPP is, however, not exceptional. In the history of the Earth there have been many fluctuations in the amount of vegetation. There was 50% more forest area on the planet 10,000 years ago in the Holocene Thermal Maximum than there is today. The research models the global GPP response to increasing CO₂, based on the mean value of eight different long-term GPP datasets. It illustrates a diminishing return of vegetation associated with rising CO₂, as additional factors such as nutrient and water availability impose constraints on the fertilization effect. Bacterial processes responsible for the breakdown of organic material on and in the soil are exponentially related to temperature. A period of rising temperatures can lead to more respiration from the large carbon buffers in the soil and oceans and thus a higher CO₂ concentration in the atmosphere and greening of the Earth. The paper says “High CO₂ levels, similar to today's, were therefore necessary for comparable GPP during green periods like 10,000 years ago. A CO₂ concentration of 280 ppm would only be possible if nature’s response to CO₂ were fundamentally different from what we observe today, with other constraining factors exceptionally more favorable. Natural fluctuations of the atmospheric CO₂ concentration can be well explained, based on the strong temperature dependence of the degeneration of carbon compounds that are stored in large quantities in the soil and the oceans.” It is very unlikely that historical CO₂ levels during the HTM and previous inter-glacials were as low as generally accepted. This conclusion contradicts the assumed low CO₂ concentrations in the past 800,000 years, based on the ice core records from Antarctica. Several studies have raised serious questions regarding the accuracy and reliability of ice core data, especially with respect to the dissolvement of CO₂ in melting water the many years before the air bubbles in the ice are fully closed.
Donald Trumps Climate Speech at the United Nations
Following is an edited version of the climate and energy portion of the speech by US President Donald Trump to the United Nations on September 23, 2025.
Energy is another area where the United States is now thriving like never before. We're getting rid of the falsely named renewables. They're too expensive. They're not strong enough to fire up the plants that you need to make your country great. Those big windmills are so pathetic and so bad, so expensive to operate, and they have to be rebuilt all the time and they start to rust and rot. Most expensive energy ever conceived. You're supposed to make money with energy, not lose money. You can't put them out without massive subsidies. And most of them are built in China. They use coal, they use gas, but they don't like wind, but they like selling the windmills. Europe on the other hand, is on the brink of destruction because of the green energy agenda. Germany was being led down a very sick path on energy. They were going green and they were going bankrupt. And the new leadership came in and they went back to where they were with fossil fuel and with nuclear, which is good, it's now safe and you can do it properly.
Aberdeen was the oil capital of Europe and this tremendous oil that hasn't been found in the North Sea. They essentially closed it by making it so highly taxed that no oil company can go there. They have tremendous oil left and more importantly, they have tremendous oil that hasn't even been found yet. And what a tremendous asset for the United Kingdom.
In 1982, the executive director of the United Nations Environmental Program predicted that by the year 2000, climate change would cause a global catastrophe. Another UN official stated in 1989 that within a decade, entire nations could be wiped off the map by global warming. Not happening. It used to be global cooling. They said, global cooling will kill the world. We have to do something. Then they said global warming will kill the world. It's the greatest con job ever perpetrated on the world, in my opinion. All of these predictions made by the United Nations and many others, often for bad reasons were wrong. If you don't get away from this green scam, your country is going to fail.
The carbon footprint is a hoax made up by people with evil intentions and they're heading down a path of total destruction. It's a con job at extreme cost and expense. Europe reduced its own carbon footprint by 37%. Congratulations Europe. You cost yourself a lot of jobs, a lot of factories closed, but you reduced the carbon footprint. However, for all of that sacrifice and much more, it's been totally wiped out and then some by a global increase of 54%, much of it coming from China, which now produces more CO2 than all the other developed nations in the world. In the United States, we have still radicalized environmentalists and they want the factories to stop. No more cows. I guess they want to kill all the cows. The primary effect of these brutal green energy policies has not been to help the environment, but to redistribute manufacturing and industrial activity from developed countries that follow the insane rules that are put down, to polluting countries that break the rules and are making a fortune.
European electricity bills are now four to five times more expensive than those in China, and two to three times higher than the United States, and our bills are coming way down. Our gasoline prices are way down. So, while the U.S. has approximately 1,300 heat-related deaths annually, that’s a lot, Europe loses more than 175,000 people to heat deaths each year because the cost is so expensive they can’t turn on an air conditioner. All in the name of pretending to stop the global warming hoax. The entire globalist concept of asking successful, industrialized nations to inflict pain on themselves and radically disrupt their entire societies must be rejected immediately, and it must be immediate. That’s why in America, I withdrew from the fake Paris Climate Accord, where, by the way, America was paying so much more than every country. China didn’t have to pay until 2030. Russia was given an old standard that was easy to meet, a 1990 standard. But for the United States, we’re supposed to pay like a trillion dollars. And I said, “This is another scam.”
CliSci # 438 2025-10-04
Food Prices, Farming and Net Zero Ideology with Dr. Joseph Fournier
Dr. Joseph Fournier gave a presentation on September 25 for the Friends of Science Society in Calgary, Alberta. Fournier showed that hydrocarbons are largely responsible for the modern era of increasing wealth and the technology boom. Fournier discussed the green revolution that greatly increased farming efficiency. Canada’a boreal forest methane emissions are much greater than those from our agriculture and oil & gas industries. Hydrocarbon based fertilizers and large farm machinery run on diesel fuel are essential. Farm machinery can’t run on electric batteries as the weight would compact and destroy the soil quality. The video of the presentation and the slides in PDF format are posted on the friendsofscience.org event page. See our news release about the event.
Greenland Ice Sheet Runoff Reduced by Meltwater Refreezing in Bare Ice
This study published in Nature and summarize by this blog post by Charles Rotter shows that climate models overestimate runoff from the ice sheet to the oceans. The paper’s abstract says the study “used field measurements and numerical modeling to reveal that extensive retention and refreezing also occurs in bare glacier ice.” The study reported that from 2009 to 2018, meltwater refreezing in glacier ice reduced runoff by an estimated 11–17 gigatonnes per year in southwest Greenland alone, equivalent to 9–15% of this sector’s annual meltwater runoff simulated by climate models. The paper says “There is substantial observational evidence that these models overestimate runoff from bare ice surfaces. In the ablation zone of Greenland’s melt-intensive southwest sector, proglacial and supraglacial river discharge measurements reveal up to 67% less annual meltwater release to surrounding oceans than climate model calculations.” The blog post explains “modelers assumed Greenland’s exposed ice behaves like a granite countertop—whatever melts immediately runs off. But when field scientists actually drilled cores and measured densities, they found a “meltwater-saturated weathering crust” with a density of just 690 kg/m³. Far from being impermeable, the surface was riddled with pores that soaked up water like a sponge. That meltwater then froze solid again during cold polar nights. Rotter wrote “When the ice sheet itself proves the [climate] models wrong, perhaps the responsible course is not to double down on the models but to rethink their authority. Skepticism—the active suspension of judgment until evidence is sufficient—would demand it.”
The 2025 Arctic Sea Ice Minimum Extent
Pierre Gosselin reviewed Arctic sea ice data and wrote ”According to the US National Snow and Ice data Center (NSIDC) at the University of Colorado Boulder, the Arctic sea ice melt this year has long reached its low point, falling to 4.602 million square kilometers on September 10th. Compared to the record low of 3.387 million square kilometers that occurred 13 years ago, 2012, this year’s value is more than 1.2 million square kilometers greater, and nearly half a million square kilometers more than 2007 (4.155 million square kilometers.)” Here is a chart of NSIDC Arctic sea ice extent for five selected years. The dark gray line is the 1981-2010 median.

Al Gore said in his Nobel Prize Lecture in Oslo, Norway, on 10 December 2007 “One study estimated that it [Arctic sea ice] could be completely gone during summer in less than twenty-two years. Another new study to be presented by US Navy researchers later this week, warns it could happen in as little as seven years.” But 22 year and 7 years from 2007 would be 2029 and 2014, respectively. The Arctic wasn’t ice free in 2014 and it is extremely unlikely to be so in 2029. The Arctic annual minimum sea ice trend has been flat for almost two decades.
Australia’s Big Snowy 2 Pumped Hydro Scheme Suffers Another Cost Blowout
Snowy 2.0 Pumped Storage Power Station is a pumped-hydro battery megaproject in Kosciuszko national park in New South Wales, Australia. The project connects two existing dams through a 27 km underground tunnel and a new, underground pumped-hydro power station. The purpose of the project is to provide backup electrical power for intermittent wind and solar generation. The original cost of the project was estimated in March 2007 at around A$2 billion. A feasibility study released in December 2007 estimated the cost to be between A3.8 – 4.5 billion to provide 2 GW of power and 350 GWh of storage and could be completed by 2024. The cost estimate increased in May 2023 to A$5.9 billion, then revised to A$12 billion in August 2023 to be complete in December 2028 with the capacity increased to 2.2 GW. [A$12 billion = US7.9 billion = C$13 billion]
The pumped hydro project is 67% complete, but supply chain cost increases and issues with a borer have caused a cost overrun. A tunnel boring machine became stuck in 2024. To keep the project on schedule a fourth tunnel boring machine is needed. A project executive said “the cost of adding a fourth boring machine could not be covered within the most recent project price tag.” A new cost estimate has been requested from the main contractor. Eric Worrall wrote “Even if the project is completed, it will not help make green energy economical. … The original 2017 feasibility study estimated round trip electricity losses are at least 33%, even without transmission losses. … Snowy 2 is the fever dream of people desperate to make their unaffordable Net Zero dreams succeed, but in practice is turning out to be as useless as every other attempt to make renewable energy work.”
Increasing Tree Size Across Amazonia due to CO2 Fertilization
A new paper assessed recent changes in the structure of Earth’s largest tropical forest by analysing 30 years of Amazonian tree records across 188 mature forest plots. The paper’s abstract reported that “trees have become larger over time, with mean tree basal area increasing by 3.3% per decade. Larger trees have increased in both number and size, yet we observed similar rates of relative size gain in large and small trees. This evidence is consistent with a resource-driven [CO2 fertilization and nitrogen deposition] boost for larger trees but also a reduction in suppression among smaller trees.” The paper shows that “The rate of change in mean tree size was three times greater than the increase in the median tree size. … The increase in tree size was observed across the whole community. … Atmospheric CO2 has progressively increased year after year globally and across all tropical forests, consistent with the Amazonian-wide tree size increase. Thus, we conclude that the increase in atmospheric CO2 is the most likely, although potentially not only, driver of the observed increase in tree size.”
Commenting on the paper, Anthony Watts wrote “For decades, we’ve been warned that the Amazon rainforest—the so-called “lungs of the planet”—was on the verge of collapse. Headlines screamed about tipping points, mass die-offs of giant trees, and irreversible climate catastrophe.” Yet, the Amazon trees are “getting bigger, fatter, and taller. This is the CO₂ fertilization effect in action. The key driver, according to the authors, is not some vague ‘forest resilience’ or a miraculous recovery from past disturbance, but rather plain old plant biology: more carbon dioxide in the air means more raw material for photosynthesis. CO₂ fertilization is no longer a theory tested only in labs. This study confirms it at continental scale: Amazon forests are thriving, not suffering, in a world with more CO₂.”
CliSci # 437 2025-09-15
Friends of Science Major Event: Food Prices, Farming and Net Zero Ideology with Dr. Joseph Fournier
September 25, 2025 – 7 pm Calgary, AB. Join us in person or via live stream.
Dr. Fournier will guide us on a captivating journey, drawing from his recent experience as a sheep rancher in Southern Alberta, alongside his deep passion for history and earth science. He’ll challenge the skewed narratives surrounding modern farming, revealing their disconnect from reality. Our current way of life relies on the evolution of mechanized, energy-intensive, and highly productive farming practices over the 20th and 21st centuries. Highlighting zero-till methods and nitrogen fertilizers, he’ll showcase their role in boosting yields and drought resilience. Dr. Fournier aims to counter the risky Net Zero ideologies that threaten to undo humanity’s hard-won progress.
Check out our event page for more information and to purchase tickets. Ticket prices are $25 for Friends of Science members and $30 for non-members.
Out of Town or Happier at Home? Join our livestream - Tickets are $10 for non-members and free for Members. Members have been sent a link to register.
Greenland’s Meltwater is Fuelling Enhanced Life in the Seas
Runoff from Greenland’s vast ice sheet is stirring nutrients from deep in the ocean and helping phytoplankton flourish, according to new research backed by NASA. This article from SciTechDaily reports that glacial runoff near Greenland’s Jakobshavn Glacier lifts nutrient-rich deep waters to the surface, fuelling summer phytoplankton blooms by up to 40%. The study used advanced computer simulations to model the interaction of marine life and water movement in a turbulent Greenland fjord. The phytoplankton absorb carbon dioxide and form the foundation of global fisheries. The glacier’s meltwater bores holes down through the ice. Fresh water runs to the bottom of the glacier where it flows between the ice and the glacier bed and shoots out in a plume at the glacier base and into the surrounding ocean. As the fresh water rises it carries vital nutrients such as iron and nitrate to the phytoplankton at the surface. They feed krill and other small creatures, which in turn sustain larger marine animals, including fish, seals and whales. NASA satellite data found that the rate of phytoplankton growth in Arctic waters surged 57% between 1998 and 2018 alone.
Corals Thrived 6,000–10,000 Years Ago Amid Much Warmer Temperatures
Coral grew far faster when oceans were warmer and up to two meters higher than today. New research from Indonesia indicates that from about 6,000 to 10,000 years ago, when the ocean was warmer than today, coral reef growth was rapid, averaging ~6 mm per year. The Indo-Pacific region has the world’s highest sea surface temperatures and the highest coral diversity. The researchers presented data of 16 cores from two islands of different reef zones from the South Sulawesi, Indonesia. The abstract says “Cores were taken from the reef flat and slope, with recovered length varying from 0.41 to 3.53 m, providing a history of each reef after radiocarbon dating. From 7200 to 5500 YBP, sea level rise rapidly increased and these reef complexes accreted at rates able to match this.”
A Global Perspective on Local Sea Level Changes
Two researchers from The Netherlands authored this paper that compared local projections and observations regarding the rate of rise in 2020. Geographic coverage of the suitable locations to establish the rate of rise in 2020 is poor with Latin America and Africa being severely under-represented. Statistical test found that 95% of the suitable locations show no statistically significant acceleration of the rate of sea level rise. The abstract says “The investigation suggests that local, non-climatic phenomena are a plausible cause of the accelerated sea level rise observed at the remaining 5% of the suitable locations. On average, the rate of rise projected by the IPCC is biased upward with approximately 2 mm per year in comparison with the observed rate.”
The tide gauge data were selected according to the criteria: the latest year is not earlier than 2015, data available over at least 60 years and at least 80% of the years in the range with data available. Of the 1533 locations in the Permanent Service for Mean Sea Level (PSMSL) network of tide gauges, 204 (14%) met the selection criteria and were analyzed. The mean rate of sea level rise is 1.4 mm/year, and the median is 1.5 mm/year. Ninety percent of the rates lie between −5.9 mm/year and 6.8 mm/year. In 2021, the IPCC published sea level rise rates as given in the Sea Level Projection Tool. The IPCC median rates of sea level rise in 2020 were compared to the median rate in 2020 derived from the PSMSL data in figure 8 of the paper. It shows the rate of sea level rise in the IPCC projections is too high by about 2 mm/yr compared to the empirical rate.
DOE Climate Report Forces New Debate on Climate Change
The previous CliSci of September 1 provided a brief introduction to the Climate Report commissioned by the US Department of Energy (DOE). It also shows a summary of comments that I submitted concerning that report. Stirling Burnett wrote “U.S. DOE’s recent climate report restarted the largely dormant debate about the possible causes and consequences of climate change. For nearly 20 years previously, the debate was over, as far as the media was concerned: catastrophic human-caused climate change was beyond discussion, a proven fact. The DOE’s report blew that narrative up, forcing the researchers to engage in a scientific debate once again.” Comments submitted by H.Stirling Burnett on behalf of the Heartland Institute are summarized below:
“The DOE Climate Report (hereafter, DOECR) serves as powerful refutation of the oft-repeated claims that the science is settled concerning the role humans are playing in ongoing climate change and that present climate change poses an existential crisis meriting a wholesale government-directed remaking of the economy, eschewing the use of hydrocarbons to prevent a dangerous increase in greenhouse gas emissions.” Burnett praises the discussion about the benefits of both CO2 fertilization for crops and other plants and the benefits of warming on human health. He says the section “on the influence of urbanization on measured temperature trends is not as strong as it could be.” He notes that rural stations measurements are also biased where temperature stations are poorly sited, and that temperatures are “reported” from stations that have been closed. “These measurements are nothing more than guesstimates assigned to a location based on temperatures from nearby stations which may, in fact, not be representative of the temperatures that would have been recorded at the ghost site had it still been in operation.” He argues that the large range of estimate of the equilibrium climate sensitivity (ECS) implies that “our understanding of the ECS is incomplete or inadequate, climate projections-based greenhouse gas driven ECS changes are not fit for scientific pronouncements.” It shouldn’t be used to impose policies that restricts personal freedoms and economic prosperity.
For the key mid-troposphere part of the atmosphere, the “observed warming trends are so small as to be consistent with the output of models that have no anthropogenic CO2, and inconsistent with the entire envelope of warming trends generated by models forced with increased CO2.” Climate policies “will likely result in greater harm to human health and welfare than the realistically expected negative impacts of climate change itself. Economically, climate policies are worse for the world than ongoing climate change accompanied by hydrocarbon use.”
Blame Pollution Cuts for Rising Temperatures
A recent study published in Nature indicates a significant portion of recent global average warming is attributable to a decline in aerosol pollution from East Asian nations as a decline in emissions from power plants and transportation has changed the nature of clouds. China’s strong effort to reduce air pollution resulted in a 20 megatonnes per year reduction of sulphur dioxide (SO2) emissions, or about 75%. The research suggests as much as two-thirds of the Earth’s warming experienced since 2001 is directly attributable to changes in cloud cover and the impact on the amount of sunlight being reflected (or not) back into space as a result of the decline in SO2 emissions. SO2 is the precursor gas of sulfate aerosols. A 75% reduction in East Asian sulfate emissions has reduced cloud cover and decreased the Earth’s albedo, causing the recent warming. The researchers wrote in the abstract “We find a rapidly evolving global, annual mean warming of 0.07 ± 0.05 °C, sufficient to be a main driver of the uptick in global warming rate since 2010. We also find North-Pacific warming and a top-of-atmosphere radiative imbalance that are qualitatively consistent with recent observations. East Asian aerosol cleanup is thus likely a key contributor to recent global warming acceleration and to Pacific warming trends.” The regulations by the International Maritime Organization that caused a strong drop in SO2 emissions from the global shipping fleet from 2020 and onwards has also contributed to the recent warming. The paper also notes that the emissions dataset used in the most recent climate models (CMIP6) used in the latest IPCC assessment report (AR6) did not accurately represent the recent reduction in East Asian SO2 pollution.
CliSci # 436 2025-09-01
Friends of Science Major Event: Food Prices, Farming and Net Zero Ideology with Dr. Joseph Fournier
September 25, 2025 – 7 pm Calgary, AB. Join us in person or via live stream.
Dr. Fournier will guide us on a captivating journey, drawing from his recent experience as a sheep rancher in Southern Alberta, alongside his deep passion for history and earth science. He’ll challenge the skewed narratives surrounding modern farming, revealing their disconnect from reality. Our current way of life relies on the evolution of mechanized, energy-intensive, and highly productive farming practices over the 20th and 21st centuries. Highlighting zero-till methods and nitrogen fertilizers, he’ll showcase their role in boosting yields and drought resilience. Dr. Fournier aims to counter the risky Net Zero ideologies that threaten to undo humanity’s hard-won progress.
Check out our event page for more information and to purchase tickets.
Early Bird tickets are $20 for Friends of Science members and $25 for non-members until September 10th - $5 off Regular prices.
Out of Town or Happier at Home? Join our livestream - Tickets are $10 for non-members and free for Members. Members have been sent a link to register.
Critical Review of Impacts of Greenhouse Gas Emissions on the U.S. Climate
The U.S. Department of Energy published a draft report that reviews the impacts of greenhouse gas emission on climate by five authors; John Christy, Ph.D., Judith Curry, Ph.D., Steven Koonin, Ph.D., Roy Spencer, Ph.D. and Canadian economist Ross McKitrick, Ph.D. See the FoS blog here for a description of the report and summaries of the foreword and 12 chapters. Michelle Stirling reads brief chapter summaries in this video. The authors have published books, articles and papers about climate, and are featured in many videos, including testimonies to various US Senate Committees. The report concludes that a more nuanced approach is required with regard to carbon dioxide (CO2) from human industrial emissions, “An approach that acknowledges both the potential risks and benefits of CO2, rather than relying on flawed models and extreme scenarios, is essential for informed and effective decision-making.”
Comments by Ken Gregory on the Draft Report by the DOE's Climate Working Group
FoS Director Ken Gregory submitted comments regarding the DOE’s climate report to the comment portal at the U.S. Federal Register. The comments say that the report underestimates the urban heat island effect (UHIE) by stating that only 30% to 50% of the land temperature trend of government datasets are attributable to the effect, whereas the two major global studies of the UHIE show that it contributes about 50% of the land temperature trend since 1980. This correction to the land temperature trend makes the land trend near equal to the sea surface temperature trend, as it should be. Cities were not located where the founders thought that those locations would naturally warm the fastest in the future, contrary to the IPCC statement on the UHIE.
When the temperature change over the historical period used in Lewis 2022 is reduced by removing the warming caused by the UHIE and the millennium cycle, the median ECS is reduced from 2.16 °C to 1.61 °C. The climate components of the DICE and FUND economic models warm faster than climate models at a given ECS. The CO2 fertilization effect in FUND should be increased by 30% due to recent studies of the effect. DICE has no CO2 fertilization effect so it should not be used for determining public policy. FUND projects the economic impact of 3 °C of global warming from 2000 of USA energy consumption to be -0.80% of GDP, whereas a recent analysis of the EIA data indicates the impact would be +0.07% of GDP. The social cost of carbon (SCC) is calculated by FUND to be about -13 US$/tCO2 at a 3% discount rate and about -7 US$/tCO2 at a 5% discount rate using an ECS of 1.6 °C when applying the above corrections. The negative signs indicate that current emissions are net beneficial. The SCC is used to set carbon taxes.
Cloud Altitude Shifts Found to have Minimal Impact on Earth's Climate Sensitivity
An increase of high clouds would have a warming effect and an increase of low clouds would have a cooling effect. A new study by the Max Planck Institute for Meteorology investigates if global warming is likely to change the altitude of clouds and their brightness as discussed in this Phys.org article. The scientists used a simplified, idealized model to test if clouds changed their altitudes with warming. The article says “The researchers introduced clouds in three layers: low clouds near the surface, mid-level clouds forming at freezing level, and high ice clouds. The experiment assumed that the albedo of these clouds did not change with increasing global temperatures, but allowed them to rise or sink.” The model’s climate sensitivity was calculated for many cloud property configurations. The result; “When the researchers increased the temperature in their model, low clouds remained at the same pressure level and became warmer. Mid-level and high clouds moved to higher altitudes and largely maintained their temperature. Although the unchanged temperature leads to more warming, the higher altitude also dampens the greenhouse effect of carbon dioxide. These two effects cancel each other out, so that the overall climate sensitivity remains nearly unchanged.”
Lindzen & Happer: Do Anthropogenic Emissions of Greenhouse Gases Endanger Public Health and Welfare?
Dr. Richard Lindzen and Dr. William Happer wrote this submission to a committee of the U.S. National Academies of Sciences, Engineering, and Medicine. The committee is charged to review evidence on whether anthropogenic emissions of greenhouse gases are anticipated to endanger public health and welfare in the United States with a focus on evidence gathered since 2009.
The authors wrote “In our scientific opinion, the Endangerment Finding is not based on science for four separate reasons:
- It is based on unscientific evidence.
- It failed to consider the physics that demonstrates that increasing carbon dioxide (CO2), other greenhouse gases and fossil fuel use will have a trivial effect on temperature and cannot and will not cause catastrophic warming and extreme weather.
- It failed to consider the essential benefits of CO2 to life on Earth, including that doubling CO2 from today’s 420 parts per million to 840 ppm will increase the world’s food supply by 40%.
- It failed to consider the science that eliminating CO2 and fossil fuels will have disastrous effects for Americans, the poor and people worldwide.
Therefore, for these four reasons separately and together, science demonstrates that human emissions of CO2 and other GHGs and the use of fossil fuels cannot endanger public health and welfare in the U.S. and instead provide benefits to public health and welfare. Thus, the Endangerment Finding should be repealed ASAP.”
The submission goes into much detail about these four reasons. It explains what is and what is not science. Both the Endangerment Finding and its Technical Support Document “violate the scientific method in numerous ways and therefore provide no scientific knowledge that supports the Endangerment Finding.” They also wrote “Further, scientific reality requires urgent action to repeal the Endangerment Finding and other government actions based on it because we are confronted with policies that destroy western economies, impoverish the working middle class, condemn billions of the world's poorest to continued poverty and increased starvation, and leave our children despairing over the alleged absence of a future, and will enrich the enemies of the West who are enjoying the spectacle of our suicide march.”
Battery Storage Delusion
German energy economist Lars Schernikau wrote a comprehensive essay on the “Pros and Cons of Utility-Scale Battery Storage”. The expansion of utility-scale batteries for providing grid storage especially for solar is one of the hottest topics of the “energy transition” these days. Despite the recent drop in power storage costs, storing electricity remains 100-1000 times more expensive than storing energy in the form of coal, oil, or natural gas. Transporting electricity is about 10-50 times more expensive than transporting energy in the form of coal, oil, or natural gas.
Most utility-scale batteries are ONLY required because of the ever-increasing installed capacity of intermittent, weather dependent wind and solar power, which are largely useless without extensive and complex network integration, backup, and storage systems. They provide backup storage for a few hours at best and they deteriorate at a rate of 3-7 % per year. Utility-scale batteries are expected to last on average 10-13 years. Real life round-trip efficiency of batteries is around 70-80%. 1 GWh of lithium-ion batteries requires about 450 GWh of energy before the battery can be charged for the first time. The embedded energy of metals and materials required to build utility-scale batteries make up about 90% of the entire energy input required. A 1 GWh lithium-ion battery system is equivalent to nearly 900 tons of TNT, with potential for large explosions, fires and clouds of toxic gas.
CliSci # 435 2025-08-13
Outpacing Climate Change: Adaptation to Heatwaves in Europe
A new paper analyzed mortality, temperatures and electricity use to investigate the adaptation to heatwaves in Europe over the period 2000 to 2022. The paper found that Europeans can tolerate an additional 1°C of temperature rise every 18 years without an increase in mortality. Increasing economic output enabled tolerating each additional 1 °C due to a per capita GDP increase of 20 thousand euros, most likely due to greater air conditioning affordability. The study emphasizes the importance of economic growth and reducing energy poverty for reducing heat-related mortality. The analysis included 85 regions across 25 countries that had complete data across all required variables.
Long-term studies have shown a significant decline in heat-related deaths despite increasing temperatures. Unfortunately, current predictions of climate change impacts assume little or no adaptation to climate change, falsely projecting significantly increased heatwave mortality.
Attribution Studies Don’t Prove Anything About South Africa’s Floods
Linnea Lueken, a climate researcher at the Heartland Institute, wrote this article that criticized an attribution study which claimed that climate change made a 2022 flood in South African “significantly” worse. She wrote “This is an unfalsifiable (not able to be proven or disproven experimentally or observationally) claim that ignores the complexities of weather, and relies on distinctly unreliable computer modelling.” Phys.org claims the study “shows that rainfall during the storm of 11–12 April 2022 was between 40 percent and 107 percent heavier than it would have been in a cooler, pre-industrial climate.” That study used computer models that simulated a world with today’s climate and a counter-factual world with pre-industrial (1850-1900) temperatures. The model is run many times and the frequency of South African floods is compared in the warm and cool climate states. Lueken points out that that “there is good reason to believe the Earth’s climate and weather systems cannot be modelled accurately to the degree attribution scientists claim because of the interconnectedness and chaotic nature of the different systems.” The IPCC had reported that floods are not correlated to rainfall trends. The construction of non-permeable surfaces like roads, buildings and parking lots can exacerbate flooding in places where rainfall trends have not changed. This fact isn’t included in the modeling. Durban, South Africa, has a long history of flooding. “People who persist in living in regions prone to flooding should be prepared, regardless of climate change.”
Solar Cycles in 150 Years of Global Sea Surface Temperature Data
This paper demonstrates that a solar cycle response exists in global sea surface temperatures (SST). Signals of warming during solar maximum and cooling during solar minimum years are found in the global SST over the 14 cycles from 1854–2007. The magnitude of the solar cycle response averaged over the oceans between 60°S and 60°N is about 0.1°C of warming for each W/m2 variation of the total solar irradiance. This value was determined after excluding suspected bad data. The multidecadal trend of response to solar forcing is found to account for about a quarter of the observed warming in SST during the past 150 yr. The abstract says “The signal is robust provided that the years near the Second World War are excluded, during which transitions from British ships to U.S. ships introduced warm bias in the SST.”
Dinosaur Teeth Serve as 'Climate Time Capsules’
Phys.org reports on a new study that uses fossilized dinosaur teeth to infer the carbon dioxide (CO2) concentrations during the Mesozoic era, when the dinosaurs lived. Fossilized dinosaur teeth show that concentrations of CO2 in the atmosphere during the Mesozoic Era, i.e., 252 to 66 million years ago, were far higher than they are today. Tooth enamel is one of the most stable biological materials. It contains three isotopes of the oxygen that a dinosaur would have inhaled with the air. The ratios of the isotopes of oxygen are related to the CO2 concentrations and the photosynthetic activity at the time the dinosaurs lived. The study shows that during the Jurassic period 150 million years ago the CO2 level was about 1,200 ppm, or about 4 times the pre-industrial level. The oxygen isotope ratios can also be used as a proxy for gross primary production (GPP). Changes in the isotope ratios could also point to substantial fluctuations in GPP of the biosphere. The paper’s abstract says that the data “imply a 20 to 120% higher GPP in the Mesozoic than today. Overall, triple oxygen isotope analysis of fossil teeth of terrestrial amniotes can provide insights into past atmospheric greenhouse gas content and global primary productivity.”
Science Groupthink Flounders on State of Great Barrier Reef
Australian Institute of Marine Science published its annual summary report on the state of the Great Barrier Reef. The executive summary of the 2025 report says “The 2024 mass coral bleaching event was the fifth mass coral bleaching event on the GBR since 2016 … The 2024 event had the largest spatial footprint ever recorded on the GBR, with high to extreme bleaching prevalence observed across all three regions of the GBR. Regional declines ranged between 14% and 30% compared to 2024 levels”. However, the decline occurred immediately after three years of record high coral cover. Dr. Peter Ridd wrote “The latest 2025 statistics on the amount of coral on the Great Barrier Reef show the reef is still doing fine despite having six allegedly cataclysmic coral bleaching events in the last decade. The normalized coral cover dropped from a record high number of 0.36 down to 0.29, but there is still twice as much coral as in 2012. The raw coral cover number for all the last five years has been higher than any of the previous years since records began in 1985. However, when one considers the uncertainty margin, the present figures are not significantly different from many of the previous years. The Australian Institute of Marine Science collects coral data on around 100 of the 3000 individual coral reefs of the GBR. Analysis of the data at smaller scales shows the GBR is doing what it always does – change. There is a constant dynamic as cyclones, starfish plagues and bleaching events dramatically kill lots of coral in small areas, while it quietly regrows elsewhere.”
Urban Microclimates: Surface Temperature Trends Across Ten Major Cities
This paper investigates the land surface temperature, a vegetation index and changes in land use types for 10 major cities between 2001 and 2021. Most cities exhibited an increasing trend in surface temperatures. Temperatures at airports were 2.5 °C higher than surrounding areas and industrial zones were 2.8 °C higher than surrounding areas. Areas with dense vegetation showed a notable cooling effect with temperature difference reaching -3.7 °C. Mexico City’s green spaces are up to 12.1 °C cooler than its urban core. The findings indicate that reductions in vegetation and water bodies are consistently correlated with an increase in day temperatures. Newly urbanized areas significantly reflected the thermal impacts of replacing natural surfaces with impervious materials, leading to notable warming trends in these regions. In Tokyo and SaoPaulo, despite the absence of a spatial urban expansion (1.0% and 0.9%), both daytime and nighttime urban heat island (UHI) effects have increased over the past 20 years.
Japan Meteorological Agency Data Show Number of Pacific Typhoons has Declined
A typhoon is a type of tropical cyclone, specifically one that occurs in the Northwestern Pacific Ocean, generally between 180° and 100°E. This article by Kirye reviews typhoon data. She wrote “Comprehensive data from the Japan Meteorological Agency (JMA) reveal the real trends when it comes to Pacific typhoon activity. Global warming alarmists claim the global climate is becoming harsher due to man-made CO2 emissions and, as a result, storm activity and extreme weather are becoming increasingly frequent. A look at the data, however, tells us the opposite is true when it gets down to typhoon activity.” Kirye produced this graph of typhoon frequency from JMA data for the period 1952 to 2024. Based on the best fit linear trend, the typhoon count has declined from 28 per year in 1952 to 24 per year in 2014. It is possible that the typhoon count might be undercounted before 1980 because of the lack of good satellite coverage. If true, the decline in typhoon frequence might be greater than shown. Data on the Japan Landfalling Typhoon also shows a small decline, from 3 per year in 1952 to 2.8 per year based on the linear trend. The months with the highest number of typhoons in the NW Pacific are July, August, and September. The linear trend of the number of typhoons formed in July has declined from 4.0 per year in 1951 to 3.6 per year in 2025. Kirye wrote “The weather is not misbehaving more like the alarmists like to claim. In terms of typhoons, the climate has improved.”
CliSci # 434 2025-07-27
Extreme Precipitation and Floods; An Apparent Paradox
Some climate activists have used misinformation to claim that there has been an increase in flooding associated with greenhouse gas emission. The IPCC has stated that some measures of extreme precipitation in some locations have increased on climate time scales and it has attributed that increase to accumulating greenhouse gases. However, the IPCC has not detected an increase in flooding at the global scale. There has been increasing and decreasing flooding trends in some regions. Roger Pielke J. wrote that the activists “imply or state that the documented increase in extreme precipitation is associated with an increase in flooding, including flash floods - including the flood that just happened [in Texas]. This further claim, however, is false.” The apparent paradox is that extreme precipitation has increased slightly but flooding has not. Pielke lists some examples of false claims.
Pielke wrote “Increasing extreme rainfall with no corresponding increase in flooding is exactly what the best available data shows. There actually is no paradox.” This paper shows that over the recent 20-years there was no increase in flash flooding in the Texas region or the U.S. overall. This paper shows that “flood changes do not show such a consistent signal. Continental-scale studies generally find a mixture of increasing and decreasing trends, with many regions showing no discernible signal at all.” Precipitation is only one of many factors that affect floods. Some regions will experience a drying in the soil as the climate warms which could make floods from a rainfall event less probable because the ground can potentially soak up more of the rain. Reduced winter snow cover can decrease the chance of flooding arising from the combination of rainfall and rapid snowmelt. Increased extraction of water from rivers can reduce water levels and the likelihood of flooding. The median duration of a flash flood event is 2 to 3 hours. On this short time scale, the IPCC concludes “There is very low confidence about changes in sub-daily extreme precipitation.” Pielke says “Thus, these activists are taking a consensus finding of the IPCC (heavier rainfall) and using it to undercut another consensus finding of the IPCC (no increase in flooding). That’s a good way to destroy trust in climate science overall.”
Central-European Sunshine Hours, Relationship with the Atlantic Multidecadal Oscillation
This open access paper finds a strong relationship between European sunshine hours and the Atlantic Multidecadal Oscillation (AMO). The study uses various statistical techniques to assess the relationship between seven sunshine hours (SSH) datasets and the AMO. The AMO typically develops as a succession of negative and positive phases of the sea surface temperatures (SST) in the North Atlantic, each lasting roughly three to four decades. The SSH series indicate a continuous long-term cyclical trend. The analysis reveals that the periods of the main cycle of the annual AMO index and the total annual SSH of the seven datasets are all between 50 and 80 years. The paper says “The long-term trends in SSH are relevant for the solar energy production in Central Europe, both for photovoltaics and solar thermal energy. The imminent onset of a negative AMO phase with reduced SSH is likely to lead to reduced solar energy yields for at least two decades.”
Impacts of Atlantic Meridional Overturning Circulation Weakening on Arctic Amplification
Arctic amplification is the disproportionate warming of the Arctic compared to the global average. A new paper quantifies how changes in the Atlantic meridional overturning circulation (AMOC), which is a key component of the global climate system, can influence Arctic amplification. According to HadCRUT5, the Arctic region north of 70° from 1980 to 2023 has warming by 2.5 °C based on the linear trend. Over the same period the global average warming was about 0.9 °C. The Arctic annual temperatures had dropped by 0.82 °C from 2000 to 2003. The paper demonstrates that a slower AMOC can moderate the Arctic warming by the end of the twenty-first century, primarily through enhanced reflection of solar energy associated with the reduced Arctic sea ice loss. The study compared two suites of climate model simulations under the same climate change scenario but with two different AMOC states: one with a weakened AMOC and another with a steady AMOC. The authors used the extremely unlikely climate scenario RCP8.5. According to the climate models, a weakened AMOC could reduce the Arctic warming by 2 °C by the end of the century. The largest contributor to the reduced warming is a reduction in sea ice loss which causes an increased surface albedo. The weakened AMOC leads to increased ocean heat uptake and surface cooling. The weakened AMOC can also abate Arctic warming by creating marked cooling from the surface to lower-to-mid troposphere while resulting in relatively weaker cooling in the upper troposphere.
CERES Satellite Data Suggests Low Climate Sensitivity
The Clouds and the Earth’s Radiant Energy System (CERES) project provides satellite-based observations of Earth’s radiation budget and clouds. CERES instruments on several satellites measure longwave and shortwave radiation from the Earth. The longwave radiation is the radiation emitted upward to space from the Earth’s surface and clouds. The upward shortwave radiation is the reflected solar radiation which doesn’t enter the climate system. If the outgoing longwave radiation is less than the absorbed solar radiation, there is a positive top-of-atmosphere (TOA) radiative imbalance (imbalance) which increases the global average temperature.
Willis Eschenbach used the CERES database, which gives the monthly radiative fluxes in each 1° latitude by 1° longitude starting March 2000, to calculate the equilibrium climate sensitivity (ECS) to greenhouse gases. He produced a graph of imbalance versus the surface temperature by 1° latitude by 1° longitude with time averaged over 24 years. Eschenbach applied a lowess fit to the data. He calculated the slope of that fit and calculated the area weighted imbalance per degree of temperature change. Eschenbach asks “How much does the earth have to warm up to restore the 3.7 watts per square meter (W/m2) of TOA radiation imbalance that is said to result from a doubling of CO2 (2xCO2)?” Willis says the amount of warming required to rebalance the imbalance is called the ECS, but I believe that isn’t correct. The imbalance is not at an equilibrium state but is the result of a continual increase of greenhouse gases. The transient climate response (TCR) is the change in temperature after a doubling of CO2 at a constant increase of a 1%/year, which would result in a doubling in 70 years. The actual average CO2 increase from 2000 to 2024 was 0.567%/year. Willis calculates the imbalance at 6.6 W/m2 per °C of surface temperature change. This equates to a TCR 3.7/6.6 = 0.56 °C, which is the TCR at 0.567%/year CO2 increase. I call this the “slowTCR”, to distinguish it from the normal TCR with a 1%/yr CO2 increase. Using a simple 1-D climate model tuned to 3-D models, with CO2 increasing at the actual rate, I calculated that the slowTCR of 0.56 °C corresponds to an ECS of 0.68 °C, which seem much too low compared to other observation-based estimates.
I did a similar calculation using the same CERES data. Each data point is 1° latitude by 4° longitude. I applied a 4th-order polynomial fit to the average 25-year data (16200 data points) as shown in this graph. I made another graph of the slope of the fitted curve and calculated a global average imbalance of 3.95 W/m2 per °C of surface temperature change, which corresponding to a slowTRC of 0.94 °C and an ECS of 1.14 °C. The lowess fit heavily discounts data further away from the mean to discount outliers. The polynomial fit might be better as all the data is of equally high quality. Changing the best fit method has a large effect on the results.
Several papers, see here and here, argue that cloud cover can change due to atmospheric circulation changes caused by a temperature change. The analysis by Eschenbach and myself using time average CERES data doesn’t account for this possible effect and assumes that any potential temperature-caused air circulation changes will not significantly change the relationship between imbalance and temperature over the next few decades of climate change. Therefore, I did the same calculation using the four coldest years of the CERES data (2000, 2001,2008, 2011) and the four warmest years (2018, 2019,2023, 2024). The global average temperature difference between these year groups is 0.68 °C. If the air circulation changes were causing more warming, the result of the warm years would show a lower imbalance change per temperature change than the cold years. In fact, the warm years analysis has a slightly smaller change of 0.13 W/m2/°C, so it appears that this effect is leading to more warming. Therefore, the method we used to estimate ECS is likely inaccurate. It is not a simple task to estimate the ECS.
CliSci # 433 2025-07-12
The Energy Institute Changes its Primary Energy Methodology
The Energy Institute has made a major change to the methodology used in their report “2025 Statistical Review of World Energy” this year by replacing the Primary Energy Consumption (PEC) tables with the Total Energy Supply (TES) tables on a country basis. Robert Lyman summarized the report here. Lyman’s summary report shows that fossil fuels contributed 86.7% of the global primary energy consumption in 2024.
The word “Supply” doesn’t imply production on a country basis, but instead is it is the total energy required to meet its consumers’ demand. It is the energy that is either produced domestically or imported, minus what is exported or stored. The fossil fuels values are the same in the PEC and TES methods. They both show the fossil fuel energy used to meet consumers’ demand in each country including energy conversion losses and transmission losses.
The nuclear and renewable values are quite different. The PEC method used in the 2024 report gives the renewable energy as the amount of fossil fuels that would be required to generate the same amount of electric energy as the renewable source by grossing up the electricity produced by the assumed efficiency of a fossil fuel power generating plant. Therefore, the primary energy of global wind was reported for 2023 in the 2024 report as the wind power produced of 8.371 exajoules (EJ) divided by an assumed average fossil fuel power plant efficiency of 38.5%, which is 21.745 EJ. One EJ is equal to about 277.78 terawatt-hours (TWh). The PEC of global solar and hydro energy of 2023 was the solar and hydro electric energy produced divided by 38.5%. However, the nuclear energy reported was the electricity produced divided by 40.12%. I don’t know why the gross-up factor for nuclear was different from that for wind, solar and hydro energy. Using the TES methodology the nuclear energy is the electricity generation divided by 33.00%, which is much lower than the 40.12% used last year with the PEC method. The 33% factor is the assumed average efficiency of converting the generated nuclear heat to electricity. The hydro, wind and PV solar TES are equal to the gross electrical output. The efficiency factor used for concentrating solar and biomass electricity is also 33%. The 2023 TES nuclear energy given in the current report is 21.6% greater than the 2023 nuclear energy reported last year due to the reduction in the gross-up factor. Strangely, geothermal energy converted to electricity uses an efficiency factor of only 10%.
The 2023 global total PEC was reported in 2024 was 619.63 EJ. The 2023 and 2024 global total TES reported this year was 580.28 EJ and 592.22 EJ, respectively. The world energy TES increased by 2.1% in 2024. But the global primary energy of 2024 is less than the global energy of 2023 report last year by -4.4% because of the methodology change. The reported 2023 and 2024 hydroelectric TES is less than the 2023 hydroelectric PEC reported last year by -61.3% and -59.6%, respectively. The 2023 and 2024 TES of all other renewables is less than the 2023 PEC reported last year by -40.8% and -35.3%, respectively.
Melting Ice Reveals Remains of 5,900-Year-Old Trees in Wyoming
Researchers discovered more than 30 dead whitebark pine trees that were entombed in ice for millennia, representing a bygone ecosystem that could teach us about climate change as reported by the Smithsoniam Magazine. The pine trees were preserved in good condition suggesting they were rapidly covered by ice. The receding ice also revealed fragments of wooden hunting weapons. One was more than 10,000 years old. The trees are located 3090 m above sea level and 180 m higher that the current tree line. The article says “This suggests the region’s climate was once warmer than it is today.” The technical paper says “A mid-Holocene (c. 5,950 to 5,440 cal y BP) whitebark pine forest preserved within a perennial ice patch in the Greater Yellowstone Ecosystem provides insights into the consequences of past climate change and ecosystem dynamics ... Results suggest that mid-Holocene forest establishment and growth occurred under warm-season (May-Oct) mean temperatures of 6.2 °C (±0.2 °C), until a multicentury cooling anomaly suppressed temperatures below 5.8 °C, resulting in stand mortality by c. 5,440 y BP.” Tree growth initiated and persisted during the early to mid-Holocene warm period from 10,500 to 6,000 years ago. According to Cathy Whitlock at Montana State University, it "offers us a window into past conditions at high elevations since you won't see whitebark pine growing at this elevation today - that's because the climate was warmer back when these trees grew". The CO2 concentration 6000 years ago was about 280 ppm.
Safety of German Wind Turbines Heightens After 70-Meter Rotor Blade Snaps Off
A 70-metre-long rotor blade of a V150 wind turbine fell from a height of 123 m at the Lübbenow wind farm in Germany, heightening concerns about the safety of wind turbines. A huge bang was heard just before a 70 m rotor blade crashed to a hill. As reported by NoTrickszone, “The incident is one in a series of technical defects. In January 2017, a rotor blade broke near Zichow (presumably due to a pitch control failure). In 2016: An entire wind turbine tower collapsed in Grimmen. A short time later, a Nordex 149 tower in Güstow had to be taken down for safety reasons. This affected a total of 18 identical turbines in Germany following a collapse in the Ruhr area in 2021 due to a design fault.” Not only are wind turbines prone to catastrophic failures, but they severely impact the quality of life of local residents due to the noise pollution they cause.
CO2 Levels Are Delivering Bountiful Crop Harvests at Unprecedented Rates!
Vijay Jeyaraj wrote “Across the globe, elevated CO2 levels are supercharging plant growth and delivering bountiful crop harvests at unprecedented rates. Studies show that crops such as tomatoes, cucumbers, lettuce and grains grow faster and yield more under higher CO2 concentrations. This phenomenon has been verified by observations of plants in the world at large and in controlled environments over many decades. Greenhouse farming employs tent-like structures with controlled environments to grow crops. Unlike open-field agriculture, which is susceptible to the risks of weather and pests, greenhouses provide stable ecosystems that extend growing seasons and manage lighting and temperature. In addition, greenhouses can artificially elevate CO2 to levels two or three time higher than ambient atmospheric concentrations. The benefits include lower water use, reduced reliance on pesticides, year-round production and higher yields. Greenhouses now cover more than 5,000 square miles of land worldwide, 40 times the agricultural area under cover four decades ago.”
Jeyaraj discusses the success of greenhouse farms in China, India, Spain and the USA. China has 60% of the world’s greenhouse farms. Greenhouses in China have CO2 levels up to 1,200 ppm, triple the outdoor concentration. India’s greenhouse horticultural sector is growing by more than 6% annually.
1.2 Million-Year Climate Record Retrieved in Antarctica Ice Core
An international research team has successfully drilled and retrieved a 2,800 m ice core from Antarctica that dates back 1.2 million years reported msn.com. Experts from 12 European scientific institutions have spent more than 200 days drilling and processing the ice during the last four summers. From mid-November 2023 to mid-January 2024, scientists succeeded in reaching a depth of over 1,836 m, extracting a record of the climate and the atmosphere going back 195,000 years. Scientists are hoping the ice will shed light on what caused the timing of Earth's ice ages to shift suddenly about 1 million years ago, an event that nearly caused the extinction of ancient human ancestors. Studies of the original EPICA core showed that Earth's climate experienced a 100,000-year cycle of cold glacial periods, or ice ages, interspersed with warmer periods. marine sediments that revealed Earth once experienced 41,000-year glacial periods prior to 1 million years ago. This will help researchers solve a major climate riddle: why, around 1 million years ago, glacial cycles shifted from 40,000 years to 100,000 years. Each meter of ice can contain as many as 13,000 years of climate data.
The Texas Flooding Tragedy: Could It Have Been Avoided?
From July 4 through July 7, 2025, a destructive and deadly flood took place in the U.S. state of Texas. During the flooding, water levels along the Guadalupe River rose rapidly in a short time. As a result, at least 129 fatalities have been confirmed, of which at least 103 are in Kerr County, with about 170 reported missing according to Wikipedia. Cliff Mass wrote on his blog “But what is particularly disturbing is that the National Weather Service (NWS) provided excellent warnings and forecasts before the event that clearly predicted a substantial threat. And yet, no attempt at evacuation was made. Furthermore, weather model forecasts indicated the potential for a major precipitation event over this historically flood-prone region during the prior days.” The NWS forecast from 8 PM July 3 (the evening before) predicted a band of heavy rain over central Texas. During the subsequent hours, the NWS communicated increasingly strong warnings, including flash flood warnings. A children's camp on a floodplain should have been evacuated. Areas along the Guadalupe River have flooded catastrophically many times in the past, and not evacuating low-lying areas with such warnings verges on criminal neglect. The local county (Kerr) does not even have a flood warning system in place.
The New York Times falsely claimed “As the World Warms, Extreme Rain is Becoming Even More Extreme”. There is NO EVIDENCE that the central Texas floods are the result of climate change. For example, the Environmental Protection Agency has noted that flooding is DECLINING over time in that region.
CliSci # 432 2025-06-12
Roger Pielke Jr: Is there Hope for Scientific Integrity?
Roger Pielke Jr, the well-known political and climate scientist from Boulder, Colorado, gave a very interesting talk on 23 May 2025 for the Irish Climate Science Forum titled Climate Scenarios, Weather Attribution – Is There Hope for Scientific Integrity? See YouTube. Pielke discussed the challenges facing scientific integrity within climate science. He explores issues surrounding the misuse of data, flawed methodologies, and the politicization of climate research. Scientific integrity is foundational to the scientific process. Pielke structures his talk around three case studies: the misuse of the ICAT hurricane damage dataset, the problematic NOAA billion-dollar disasters dataset, and the implausible climate scenarios used by the Intergovernmental Panel on Climate Change (IPCC). Each case illustrates a failure of self-correction and raises questions about how scientific research influences policy.
The ICAT hurricane damage dataset, which originated from Chris Landsea and Pielke’s work in the 1990s. Their research showed that societal factors, such as population growth and wealth accumulation in coastal areas, drove the increase in damages, not climate trends. Later, that dataset was altered without proper documentation. The altered dataset included inflated loss estimates from NOAA’a billion-dollar disasters dataset that mixed inconsistent methodologies. Pielke’s 2023 paper in a Nature journal applied NOAA’s own scientific integrity standards and found the dataset lacking in reproducibility and consistency. The flawed ICAT and NOAA’s datasets were used in studies that were cited in the IPCC’s AR6 and the U.S. fifth national climate assessment that attributed disaster losses to climate change, ignoring a broad literature of over 60 normalized studies that didn’t attribute disaster losses to climate change. Pielke’s efforts to correct this misuse through peer-reviewed critiques and calls for retraction were met with resistance from journal editors, highlighting a failure of self-correction.
The IPCC continued use of extreme climate scenarios, particularly RCP 8.5 and its successor, SSP5-8.5. RCP 8.5, labeled as a “business-as-usual” scenario, assumes a massive increase in coal use with little natural gas consumption and a global population of 13 billion by 2100—projections Pielke deems unrealistic based on current energy trends and demographic forecasts. Real-world emissions and energy outlooks align with more moderate scenarios (2–3°C warming from 1850 to 2100), not the extreme RCP 8.5 (4–5 °C warming) used in thousands of studies.
Are Climate Model Forecasts Useful for Policy Making?
A paper presents comparisons of temperature forecasts from models relied on by the U.N.’s IPCC to forecasts from models that exclude human influence and included volcanic and one of two independent measures of solar variability. The models were used to forecast Northern Hemisphere with all land and rural only land temperatures. The authors, Dr. Kesten Green and Dr. Willie Soon, say that a statistical fit of a model’s temperature forecast to global temperatures is insufficient to conclude that the model is useful for making policy decisions. All models are tuned by adjusting parameters to make the models roughly agree with the historical temperatures. The model must also be able to forecast temperatures after that used to tune the model, more accurately and reliably than other plausible alternative models. That period is called “Out-of-sample forecasts from a model.
The study’s news release said that the authors “found models that included the IPCC’s anthropogenic (human causation) variable failed badly in temperature forecasting comparisons with models that included independent measures of variation in the Sun’s radiation. … The results were striking: Models using the IPCC anthropogenic and solar variables produced forecast errors as large as 4°C in forecasting Northern Hemisphere land temperatures that had not been used in estimating the models, and as large as 20°C in forecasting rural temperatures. The independent solar variable models’ errors were mostly much less than 1°C in forecasting the all-land temperatures, and almost always much less than 1°C in forecasting the rural temperatures.”
Dr. Green emphasized the policy implications: “Our findings suggest that IPCC modelling fails to support the hypothesis that human carbon dioxide emissions have a meaningful impact on global temperatures. Uncomfortable as it may be for policy makers, unpredictable and uncontrollable variations in radiation from the Sun and volcanic eruptions will continue to determine changes in the Earth’s climate. Policies that deny that reality cannot avoid imposing great costs on the many, to the benefit of very few”.
Direct Air Carbon Capture Comes Crashing Down: A Comedy in Subsidies
Charles Rotter wrote an amusing article about the collapse of the direct air CO2 capture (DACC) industry. Rotter wrote “The New York Times writer David Gelles practically had to mop his keyboard with tears over the news that the carbon removal market—once projected to be a trillion-dollar juggernaut—is now wheezing toward irrelevance. … 24 government grants worth $3.7 billion have been scrapped, Climeworks axed 22% of its staff, and permit applications have tanked. The ‘market’ is imploding because—brace yourself—no one wants to fund something that doesn’t work.” The media wines that it is all the fault of President Trump, saving the US taxpayer billions of dollars of useless spending. Climeworks has made international news for capturing CO2 directly from the atmosphere. The Icelandic newspaper Heimindlan reported “When Climeworks, a company based is Switzerland, opened its first capture plant in Iceland in September 2021, company officials said it could capture 4,000 tons of CO2 each year it operated. The Climeworks plant’s own emissions are 1,700 tons of CO2 in 2023. In 2023 and 2024 the plant captured 921 and 876 tonnes of CO2, which is a small fraction of its claimed capacity, and far less than its own emissions.”
Rotter said “Let’s be crystal clear: carbon capture is a thermodynamic clown show. It takes more energy to remove CO2 from the air than was released burning the fossil fuel in the first place. And even then, you still have to compress it, transport it, inject it underground, and pray it doesn’t leak back out.”
DACC requires about 5.5 MWh of electricity per tonne of CO2 captured. To capture all global energy-related CO2 emissions (37.8 GtCO2 in 2024) would require 208,000 TWh per year. This is 6.7 times the global electricity generation of 31,150 TWh in 2024.
Rotter wrote “Let’s be honest: the entire carbon capture craze was never about saving the planet. It was about:
- Making rich people feel less guilty about flying private.
- Giving bureaucrats a talking point.
- Creating a new market for companies like Microsoft to “offset” emissions without changing a single behavior.”
Unnatural 60-Second Heat Spikes Drive Many UK Met Office Temperature ‘Records’
The UK Met Office has recently introduced sensitive thermometers to replace conventional thermometers. This article published by the DailySceptic shows that the new thermometers collect 60-second unnatural heat spikes which are used to promote clickbait ‘records’ and claim exaggerated atmospheric warming. Chris Morrison wrote “Furthermore, it appears that these short-term ‘spikes’ are larger in junk sites with massive internationally recognized ‘uncertainties”. Almost eight in 10 of the Met Office’s nationwide temperature measuring stations are in junk CIMO Classes 4 and 5 with possible errors up to 2°C and 5°C respectively.” The article gives several examples of the UK Met Office using unnatural temperature spikes to promote climate alarmism. On May 1, the Met Office claimed a reading of 29.3 °C was a record high for the day. But the temperature was 0.76 °C less only a minute later. On July 19, 2022 a national record of 40.3 °C at the RAF Coningsby site was set when three typhoon jets were landing. Morrison wrote “Temperature recordings can move around from minute to minute; change, if it occurs, is generally around 0.1°C to 0.3°C. These changes do not affect old-style mercury thermometers but are picked up by the super-sensitive electronic devices used by the Met Office since the 1990s. It is for this reason that the World Meteorological Organisation (WMO) recommends averaging readings over five minutes to standardise data and remove short-term ‘noise’. For some inexplicable reason, despite playing a significant role in WMO deliberations, the UK Met Office does not appear to want to follow this sensible scientific advice.”
Checking the Government of Canada’s Climate Misinformation
Pav Penna published an article criticizing climate change misinformation in the Federal Budget of April 7, 2022 which contained the phrase: “Canada is already experiencing an increase in heat waves, wildfires, and heavy storms.” He is a researcher and a BDC consultant. Penna wrote “All three claims were demonstrably factually incorrect.” Penna’s Access to Information Act request to provide the scientific basis for the phrase was denied. The reason given was “Cabinet Confidences”! Penna previously published a letter of the Office of the Information Commissioner with the subject “Improper use of ‘Cabinet confidences’ to reject a valid complaint.” The request was forwarded to the Department of Finance (FIN). FIN failed to provide evidence to support its claim. Instead, it sent a link to a speculative report about future cost to Canada’s infrastructure. FIN misinterpreted the “Canada’s Changing Climate Report” which supports Penna’s complaint about heat waves and severe storms and ignored data from the Canadian National Fire Database showing a decline in the frequency of wildfires and the total area burned.
Penna shows that Canada Weather Stats website provides data for dozens of climate characteristics for hundreds of Canadian locations in an easy to interpret graphical format. [Also Your Environment] He presents a graph of the Ottawa’s annual maximum temperatures from 1890 to 2024. It show a cluster of high readings in the early 1900’ then declining to about 1980 then little change. The overall trend is a decline of 0.94 °C/century. The trend of number of annual days over 30 °C is a decline of 2.25 days/century [graph]. Ottawa’s mean temperatures have increased at 1.23 °C/century, but this is due to increasing low temperatures, which is a characteristic of urban warming. The increasing low temperatures are completely beneficial. Penna wrote “The reality of moderating temperatures does not support an alarmist narrative or carbon taxes as a solution.”
The ‘Canada’s Changing Climate Report’ previously mentioned says “There do not appear to be detectable trends in short-duration extreme precipitation in Canada for the country as a whole based on available station data.” Penne wrote “When the Budget was published in 2022, wildfires had been declining since 1980 in both frequency and extent. Since then, the extremely high fire season in 2023 did reverse the area burned trend. Note that a historical low was set just three years earlier in 2020.”
Penne goes on to calculate the impact of Canada’s emissions on temperature using the IPCC estimate from AR6 of 0.45 °C/1000 GtCO2. He finds “The objective of Canada’s original carbon tax was to reduce emissions by 90 Mt. If achieved, this was equivalent to postponing global warming by 1°C in 24,691 years!”
CliSci # 431 2025-05-28
Consistent Climate Fingerprinting
Dr. Ross McKitrck has a new paper about climate fingerprinting that has been accepted for publication by the journal ‘Climate Dynamics’. Climate fingerprinting refers to statistical techniques used to determine the probability that observed climate characteristics, like changes in storms, temperature and precipitation, are attributed to human activities, like greenhouse gas (GHG) emissions and urbanization, and natural causes, like changes of solar and volcanic activity. It seeks to identify the unique patterns of climate change associated with different environmental factors. McKitrick wrote on his website “When I say this method is consistent, I am using the statistical concept of consistency. It is my assertion, based on several previous publications, that the IPCC method (based on Allen and Tett 1999 and Allen and Stott 2003) yields biased and inconsistent signal detection coefficients and is uninformative for the purpose of GHG attribution.” The abstract of the paper says “I propose an alternative fingerprinting method based on the Instrumental Variables procedure with consistent standard errors and I demonstrate its potential in an application to 20th century temperature data. I find the modeled anthropogenic signal is detected but needs to be scaled down by 35 to 60%, whereas the modeled natural signal needs to be scaled up 2- to 4-fold, to reconcile optimally with observations.
Dual Impact of Global Urban Overheating on Mortality
A new paper determines the beneficial and detrimental temperature-related mortality impacts of the urban heat island (UHI) effect in more than 3,000 cities worldwide. It also assesses the urban-associated cooling strategies, including planting green plants and installing reflective infrastructure. The paper’s abstract says “This study finds that the UHI effect reduces global cold-related mortality, surpassing the increase in heat-related mortality more than fourfold. Widely implemented urban cooling strategies, including green and reflective infrastructure, can have an adverse net effect in high-latitude cities but benefit a few tropical cities. We propose seasonal adjustments to roof albedo as an actionable strategy to reduce heat- and cold-related mortality.”
There was no hint in the abstract of any economic analysis on the practicality of the proposed seasonal adjustment to roof albedo.
The figure below shows the dual impacts of the UHI effect and heat mitigation strategies on cold- and heat-related mortality relative risk for a hypothetical city.

The annual net impact represents the sum of the beneficial and detrimental impacts. a, Curves depicting the relative risk (RR) variation with temperature percentiles in two scenarios: without and with the UHI effect. b, Curves depicting the RR changes with temperature percentiles in two scenarios: without (that is, the curve with the UHI effect in a) and with urban cooling strategies.
Should Carbon Dioxide Emissions Be Reduced or Allowed to Rise Steadily?
This new paper discusses the link between climate warming and CO2 levels, focusing on several uncertainties. The paper was written by FoS advisor Madhav Khandekar and Ray Garnett. Before industrial times, warming of the earth precedes an increase in CO2 concentrations. The beneficial impacts of higher levels of CO2 on world agriculture and forestry outweigh possible harmful impacts. In last ten years, there has been more and more emphasis on switching to green energy, mostly wind and solar energy, since the conventional fossil fuel energy is identified as being the major producer of CO2 causing climate warming. It is argued that a goal of Net Zero emissions by 2050 would help maintain the global mean temperatures below the 1.5 °C as stipulated in the Paris 2015 climate treaty. The net-zero agenda could cost world economies a whopping 240 trillion US dollars. Geological records reveal a definite lag of several hundred years between warming of the climate and rise in CO2 levels.
There is now a sizable body of literature showing rising CO2 levels bring a substantial increase to world agricultural production with benefits up to 750 ppm. The current CO2 level (average 2024) is 425 ppm. Global cereal yield (wheat, rice and corn) has increased by over 200% between 1961 and 2023. Many other studies show that increased CO₂ helps plants resist drought, intense heat, pollution and other environmental stresses. Satellite data show that increasing levels of CO2 are making world forestry greener and richer. In particular, the boreal forests of high-latitude regions of Canada and in Alaska show spectacular growth and have overcome deleterious impacts of forest fires in spring and summer. The authors conclude that a steady increase in worldwide CO₂ emissions would have enormous benefits to world humanity.
Oceans are Heating Faster in Two Bands Stretching around Globe
A new paper shows that the world’s ocean are heating fastest in two latitude bands, one at 40 to 45 °S and the other around 40 °N. Within the northern band, the waters east of the United States and east of Japan are warming the fastest. The lead author, Kevin Trenberth said that the heat bands have developed since 2005 in tandem with poleward shifts in the jet stream, the powerful winds above Earth's surface that blow from west to east. There was an unusual absence of warming in the subtropics near 20° latitude in both hemispheres. The warming is non-uniform due to natural variability. The ocean heat data was processed to assess 1° latitude strips of ocean to a depth of 2000 m for the period from 2000 to 2023 to produce the following world map.

Greenhouse Gases and Fossil Fuels Climate Science
A new paper by Richard Lindzen and William Happer argues that increasing CO2 concentrations from 420 ppm to 840 ppm would increase the amount of food available worldwide by roughly 40% while having little effect on temperatures. The authors are career physicists with a special expertise in radiation physics, which describes how CO2 and greenhouse gases (GHG) affect heat flow in Earth's atmosphere. They state that in their scientific opinion the Net Zero Theory, all the Net Zero Theory rules and congressional subsidies are scientifically wrong. GHGs will not cause catastrophic global warming and more extreme weather. Instead, there will be disastrous consequences for the poor, people worldwide, future generations, Americans, and other countries if CO2 and other GHGs are reduced to Net Zero and fossil fuels eliminated. Net Zero policies will endanger public health and welfare. The summary says “In summary, the blunt scientific reality requires urgent action because we are confronted with policies that destroy western economies, impoverish the working middle class, condemn billions of the world's poorest to continued poverty and increased starvation, leave our children despairing over the alleged absence of a future, and will enrich the enemies of the West who are enjoying the spectacle of our suicide march.”
The Rise of Global Sea Ice
Dr. Roger Pielke Jr. discussed the rise of global sea ice as documented in two new papers, a preprint about the pause of Arctic sea ice decline and a peer-reviewed paper about the recent rise of Antarctic sea ice. Pielke wrote “At the South Pole, Wang et al. 2025 find a record accumulation of ice on the Antarctic ice sheet over the period 2021 to 2023, following a steady decrease from 2002 to 2021. The data comes from NASA’s GRACE series of satellites, which have the ability to precisely measure ice mass. The figure below shows that the recent accumulation is small in the context of the multi-decadal decline, but is still characterized by the paper’s authors as a ‘significant reversal.’ The paper makes no predictions of whether or how long the accumulation might continue.” Writing about the far north Pielke continues “a new preprint by England et al. identifies a ‘surprising, but not unexpected multi-decadal pause in Arctic sea ice loss.’”
Pielke wrote for the New York Post “Two new studies show that the Earth’s climate is far more complex than often acknowledged, reminding us of the importance of pragmatic energy and climate policies. … Antarctic ice has made a turnaround, scientists say, with an increase in ice mass after years of depletion.” … ‘The loss of Arctic sea ice cover has undergone a pronounced slowdown over the past two decades, across all months of the year,’ the paper’s authors write. They suggest that the ‘pause’ in Arctic sea ice decline could persist for several more decades.” The rise in Antarctic sea ice mass increased by 108 gigatonnes per year between 2021 and 2023 corresponds to a global sea level decline of 0.8 mm over the 3 years.
Correction to CliSci # 430 of 2025-05-14; The European Blackout
An astute reader noticed an error in the article “The European Blackout was caused by Unstable Solar Power” of the previous CliSci #430. I wrote “For context Alberta’s average 2024 electricity load was 242 GW.” According to AESO's 2024 Annual Market Statistics Report, Alberta's average electricity load was 10.1 GW, not 242 GW.
CliSci # 430 2025-05-14
Urban Heat Island Effects in U.S. Summer Surface Temperature Data
Dr. Roy Spencer announced on his blog on October 19, 2023 that he and John Christy have finally submitted a paper to the Journal of Applied Meteorology and Climatology entitled, “Urban Heat Island Effects in U.S. Summer Surface Temperature Data, 1880-2015“. The paper was published April 29, 2025, after more than 1.5 years of review. The paper describes a new method of estimating a major part of the urban heat island effect (UHIE). The method quantifies the sensitivity of the land station raw temperature data in the contiguous 48 states (ConUS) to population density using closely space station pair daily average temperature differences during the summer. The results are grouped into four categories of station population density. The UHIE portion of the measured warming trends ranges from 8% for rural to 65% for urban categories. The ConUS UHIE warming from 1895 to 2023 is 22% of the observed raw warming trend of 0.072 °C/decade. The UHIE trend is 0.016 °C/decade. They also find the UHIE-adjusted temperature trend of 0.073 °C/decade is even greater than the raw temperature trend, meaning that instead of removing the UHIE, the adjustments increase the UHIE.
The displayed graph (figure 5 of the paper) shows the cumulated UHIE (TUHI) warming for four population density classes and all stations.
Urban Warming in Four Population Density Ranges

The data shows (see figure 1a) that the UHI warming is best represented as a Power Law Plot, where this type of plot can represent up to 99% of the data. In a log-log plot, power laws appear as straight lines, with the slope of the line representing the power law exponent.
Table 1 of the paper shows that the lowest class of population density (PD) has an average PD of 1.2% of an urbanized class (5 in the table) but has a UHI change per PD change rate of 1800 time greater.
the caption to figure 1 in the paper includes “We see that TUHI warming was stronger in the early years than in later years. The total TUHI warming between 1880 and 2023 ranges from 0.14 C° for the least populated class to 1.4 °C for the most densely populated class of station, and 0.29 °C averaged across all GHCN stations.”
The average trend 1880-2023 is 0.020 °C/decade. The UHI warming trend for the period 1980 to 2023 is 0.010 °C/decade, about half of the trend from 1880.
Importantly, the USA temperature monitory network is considered one of the best in the World, so we can certainly expect the World UHIE will be much greater than that of the ConUS. The evaluation does not account for increasing energy use or increasing pavement and cement ground cover. If a temperature station associated with a town that had a constant population over the last 20 years, the evaluation would show no UHIE despite these obvious sources of urban warming.
The UHIE evaluation by Ross McKitrick and Patrick Michaels (M&M) summarized here, states “We can use the statistical model to estimate what the observed temperature trends would have been if [every country] had as good circumstances for monitoring climate as the US does.” The authors estimate that if the USA had no UHIE, the global land area post-adjusted temperature trend would fall from 0.30 to 0.17 °C/decade, or by about 43%. The full M&M paper states that for various reasons, “our findings should be viewed as a lower bound, or conservative estimate of the magnitude of the global data contamination.” If the M&M UHIE of the ConUS is added to the new paper’s results, the revised global land trend from 1980 could increase from 43% to 48% of the adjusted temperature trend. The M&M paper can’t be directly compared to the new paper as the first one is compared to the adjusted data and the second one is compared to the raw data. The study used most of the about 12,000 stations from the GHCN, and 215,679 station pairs.
A Critique of the Apocalyptic Climate Narrative
A paper authored by Harry DeAngelo and Judith Curry that serves as a critique of the apocalyptic climate narrative was published this month. The narrative claims that humanity faces an existential threat from global warming and the only way to save the planet is to eliminate the use of fossil fuels. This narrative ignores all benefits of warming, CO2 fertilization and the benefits of fossil fuel use. It radically overstates the risks to humanity of continued global warming, which are manageable, not existential. The narrative ignores the enormous costs of achieving net zero human-caused greenhouse gas emissions.
The Introduction says “This paper details the flaws in the apocalyptic climate narrative, including why the threat from human-caused climate change is not dire and why urgent suppression of fossil-fuel use would be unwise. We argue that sensible public policies would focus instead on developing a diversified portfolio of energy sources to support greater resilience and flexibility to respond to whatever weather and climate extremes might occur. We identify nine principles for sensible US public policies toward energy and discuss implications of the flaws in the narrative for investors and their agents.”
Those principles are;
- We should not inflict costs on U.S. citizens – reduced overall economic prosperity, constrained individual choice, and diminished national security – by adopting public policies intended to mitigate global warming.
- We should not eliminate fossil fuels before we have technologically viable and cost-effective replacements.
- We should use “carrots” to foster investment in innovation in energy and science.
- We should not use “sticks” to punish consumption that generates greenhouse gasses.
- We should cultivate clean energy to reduce air pollution and energy independence for defence and economic security reasons.
- We should put major emphasis on the resuscitation of nuclear power.
- We should not focus narrowly on solar panels, wind turbines, and biofuels.
- We should not engage in backdoor regulation of fossil-fuel use by the Federal Reserve and the SEC.
- We should not use our power to impose credit policies toward developing countries.
This paper estimates the global social net benefits of CO2 emissions in 2020 using a 3% real discount rate is US $11 ± 4 per tonne of CO2. The narrative ignores that the social costs are likely between zero and negative US $15/tCO2.
This paper estimated the incremental cost will be 2024US $220 trillion (Ca $308 trillion). Russia, Ukraine and the CIS together would be required to spend an incremental increase of 15% of their GDP on net zero, India would spend an extra 8.4% of their GDP on net zero.
The European Blackout was caused by Unstable Solar Power
The Iberian Peninsula Blackout started Monday April 28th, 2025 at 12:33 CET. The power systems of Spain and Portugal suffered a total blackout. A small area in France near Spain was also affected but for only a very short time. The blackout lasted for about 10 hours in most of the peninsula and up to 24 hours in some southern areas. At least seven people in Spain and one in Portugal may have died due to the power outage. The total disconnected load is estimated at 30 GM. For context Alberta’s average 2024 electricity load was 10.1 GW. Just before the blackout, solar and wind power provided 59% and 12%, respectively of the total load.
Jonas Kristiansen Nøland, associate professor at the Norwegian University of Science and Technology wrote on Linkedin “Recent evidence indicates that Europe's worst blackout, occurring in the Iberian Peninsula, originated from an unstable power grid. This instability likely triggered the cascading chain of events that followed. In the half-hour leading up to the blackout, two episodes of power and frequency oscillations were observed in the Continental European synchronous area. Grid operators took actions to mitigate these oscillations.
The likely root cause of these undamped ‘inter-area oscillations’ was the weak, heavy loaded interconnecting lines and the inherently low inertia of the Spanish power grid at midday, with approximately 70% of generation provided by inverter-based solar and wind. Due to these unstable grid conditions, exceptionally high rates of change of frequency occurred, which became the final nail in the coffin. As a result, low-frequency load shedding was not able kick in to save the day. The critical tipping point came with the first generation loss at 12:32:57, involving roughly 2.2 GW, likely from solar PV generation in southwest Spain—a region dominated by solar power.”
Nøland goes on to say that the unstable grid was cause by the lack of inertia and over voltages. Electrical inertia in usually provided by spinning reserves of fossil fuel power plants. This inertia resists short-term (2 to 3 seconds) variations in frequency. The frequency in Europe should be 50 ± 0.050 Hz, or a tolerance of ±0.1%. Deploying additional synchronous capacitors (used for very short-term electricity storage) would “significantly increase system costs”.
Britain Faces Months-Long Blackouts Because of Net Zero
Nick Gutteridge of The Telegraph, U.K. wrote (paywalled) “The grid operator has raised concerns that the switch from dependable gas to intermittent wind and solar power will ‘reduce network stability’.” Richard Eldred wrote about the article “Britain’s rush to Net Zero could leave it vulnerable to months-long blackouts, as reliance on intermittent renewables strains the grid, escalating costs and jeopardizing energy security.” He also provided a large quote from the article.
The grid operator said “the cost to taxpayers of funding measures to prevent the system crashing was set to ‘increase significantly’ to £1 billion a year.” Government officials said it would take Britain “several months” to fully recover from a nationwide electricity outage. Concern has risen since a power outage at the Heathrow cause chaos at the airport on May 8, 2025. That disaster was caused by “decades-old equipment filled with flammable oil” which caught fire”. Britain’s electric system operator warned last month of an increased risk of outages due to continuing reduction of synchronous power generation from natural gas and nuclear in favor of renewables that provide no inertia for stabilizing the grid. A government risk assessment found that “depending on the cause of failure and damage, restoration of critical services may take several months.”
CliSci # 429 2025-04-22
Solar Madness in Germany: Subsidized Electricity Gets Dumped Abroad for Free
The solar energy annual load factor in Germany is about 11%. The load factor is the annual solar energy production as a percentage of the solar energy that would have been produced if generated at the maximum rate throughout the year. The total installed solar capacity in Germany reached 99.3 GW at the end of December 2024. In 2024, Germany's total electricity production was 431.7 terawatt-hours (TWh), equivalent to a continuous generation of 49.3 GW. The 2024 electricity generation, the first year without any nuclear energy contribution, was 14.6% less than in 2023. Meanwhile, the 2024 electricity consumption increase by 0.9% to 462 TWh.
The large solar capacity relative to the consumer demand causes negative prices when solar generation is high. In 2023, the proportion of hours with negative prices averaged 18% and in May 2023 it was as high as 31%. However, the negative prices are not passed on to the solar generators. If they were charged for producing electricity when it wasn’t needed then there wouldn’t be any negative prices. Excess solar power is given away free of charge to Germany’s neighboring countries. This is a crisis for Germany because solar power is extremely expensive. It is heavily subsidized with taxpayer’s money over more than 30 years. Germany has spent an estimated 189 billion euros (approximately US$222 billion) on wind and solar subsidies since 2000. Pierre Gosselin wrote “This sort of absurdity is what happens when politicians and bureaucrats take over energy engineering.” Energy market expert Björn Peters is calling for an end to the expansion of solar energy and a return to fossil fuels for electricity generation.
States with Renewable Mandates and Cap & Trade Pay the Highest Electricity Prices
This report from the American Legislative Exchange Council (ALEC) says “There is very little more important to modern society than energy and electricity. It is an essential aspect of virtually every part of our daily lives. However, throughout the United States, electricity prices vary greatly, depending on the way it is generated, delivered to consumers, and regulated.” Some policies affect the electricity supply while some increase the electricity demand by promoting electrification. This brief summary shows that consumers pay higher prices for their electric utilities in states that have more regulations on their energy sector.
The weighted average 2023 price of electricity across all sectors (residential and business) was calculated and ranked. The ALEC report analyzed three energy policies shaped by state legislatures: renewable portfolio standards (RPS), participation in a CO2 cap-and-trade program, and mandated rules regarding net metering. The grids’ reliability was determines by counting the number of major incidents, including power outages.
The most expensive electricity was in Hawaii at 39.72 US cents per kilowatt hour (¢/kWh), but the report notes that the state is disadvantaged due to its isolated location. California had the second most expensive electricity at 22.33 ¢/kWh. The least expensive electricity was in Wyoming and North Dakota; both at 8.24 ¢/kWh.
The three states (Wyoming, North Dakota and Idaho) with the lowest prices do not have RPS or cap-and-trade programs. Idaho does not have mandated net metering but Wyoming does have it. In contrast, the five states with the most expensive electricity all have RPS, cap-and-trade programs and impose net metering policy on its utilities. Net metering is very costly and unfair because it forces utilities to pay for electricity produced from roof-top solar panels when the demand is low, the supply is high and prices are low (or even negative). Utilities are forced to provide the solar panels owner the same amount of electricity when the demand is high, supply is low and prices are high. This gives roof-top solar panel owners a huge financial advantage over other consumers.
California had more reliability incidents than any other state, with hundreds of thousands affected over the year. Parts of the grid were down due to major incidents for over 82 hours over the year.
The three states with the lowest electricity prices had very reliable grid systems. Wyoming only had one power outage in the year, impacting less than 5,000 residents, demonstrating the grid’s remarkable resiliency. North Dakota has a good mix of energy sources with coal providing 56% of the state’s electricity. It had only three reliability incidents. Idaho had none of the three problematic policies studied and has a very reliable grid with no major outages.
France Holds Wind Industry Accountable for Golden Eagle Death
A French court on April 9, 2025 ordered the Bernagues windfarm at Hérault, France to cease operations for one year following the confirmed death of a golden eagle that collided with one of the farm’s turbine blades in January 2023. The golden eagle is a protected species in France. The windfarm’s operator was fined €200,000, half of which was suspended, and fined the operator’s director €40,000. The Aumelas wind farm in France was ordered on April 7, 2025 to suspend operations for four months due to the death of 160 protected birds.
This article says “Two recent studies underline the broader threat to golden eagles. One, in Ecological Applications, shows that annual mortality already exceeds the threshold that eagle populations can sustain. Another, in Biological Conservation, tracks a rise in turbine-related eagle deaths in the western U.S., from 110 in 2013 to 270 in 2024.”
The article in Ecological Applications presents estimates of allowable take levels of bald eagles and golden eagles that are sustainable. Golden eagles are unintentionally killed by electrocution on power lines and collisions with wind turbine blades. The mean annual survival rates for golden eagles ranged from 0.70 for first-year birds to 0.90 for adult birds. The author’s modeling suggests that female birds on average give birth to 0.53 young annually. The population size in the western United States has averaged about 31,800 individuals for several decades. The estimated median allowable take limit is 2200 per year (95% confidence 710–4180) to maintain a stable population. The actual take is estimated at 2600 golden eagles, which is slightly greater than the allowable take limit. The human-caused deaths are 59% of all deaths, including 74% in the bird’s first year. The human-caused deaths determined by counts of transmitter-tagged golden eagles were caused by shooting 30%, collisions 28%, electrocutions 23% and poisoning 19%. Any additional human-caused deaths may not be sustainable. That is, any additional wind turbines or power lines would cause declining populations unless mitigated by new protection policies.
The article in Biological Conservation gives estimates of annual wind turbine mortalities of golden eagles in the western United States from 2013 to 2024. The authors determined areas of lower and higher risk of wind turbine collision deaths. The paper says “From 2013 to 2024, estimated turbine hazardous volume in the lower- and higher-risk zone increased by 198 % and 119 %, respectively.” Annual median golden eagle mortalities more than doubled from 110 in 2013 to 270 in 2024, although estimates had high uncertainty. The paper concludes that the recent accelerated growth and expected future growth of wind power in the western U.S. could have a significant negative impact on the golden eagle population.
Global Vegetation Growth Reaches New Highs Due to Increased CO2 Fertilization
A new paper shows that Earth had its highest level of vegetation greenness in 2020 in the modern satellite records to 2020. The greening was found mostly in the boreal and temperate vegetation, attributable mostly to rising CO2 levels, climate warming and reforestation efforts. Vegetation absorbs CO2 from the atmosphere by photosynthesis, transforming it into vital carbohydrate, which is the beginning of the food chain. Satellite observations since 1982 have reported a widespread increase of the vegetated area, often called global greening, with CO2 fertilization due to human-caused CO2 emissions explaining 70% and warming explaining 8% of the greening trend. Scientists found in 2024 that about 55% of global land mass had shown an “accelerated rate” of vegetation growth. Another study finds a large fertilization effect on crops; “a 1 part per million increase in CO2 equates to a 0.4%, 0.6%, 1% yield increase for corn, soybean and wheat respectively.”
The COVID19 pandemic had multiple effects. It caused a short-term reduction in CO2 emissions and reduced aerosol pollution which increased solar radiation enabling plants to flourish in brighter sunlight. The study used utilized three groups of remote sensing-based vegetation indices; enhanced vegetation Index, solar-induced fluorescence and leaf area index. The paper reports that global vegetation reached its peak greening in 2020, continuing a long-term trend. This suggests a robust resilience and adaptability of global vegetation in the face of changing environmental conditions. Also, see this commentary and this news release about the study.
CliSci # 428 2025-04-08
NewsGuard Reviews CliSci Discussion of the Urban Heat Island Effect
NewsGuard reviewed our March 2, 2025 Climate Science newsletter CliSci # 426, item titled “Urban Heat Island and Why Location Matters”. That article stated “the location of surface temperature stations in England, U.K. does indeed matter" and “the official temperature record is corrupted by the urban heat island effect” (UHIE). NewsGuard wrote “NewsGuard found that scientific research has shown that urban heat islands have a minimal impact on surface temperature measurements.” They referenced two published papers about the UIHE that were discussed in the IPCC’s fourth assessment report (AR4). NewsGuard asked us to “comment on this apparently countervailing information.” My reply is here.
One of the referenced papers (Peterson 2003) was reviewed on Climate Audit by Stephen McIntyre. McIntyre discovered that many ‘urban’ sites “seemingly being at best very small towns and, in some cases, rural themselves.” The paper reviewed temperatures of 289 sites in the contiguous U.S.A. Only 25% of the sites are even included in the U.S. Historical Climatology Network (USHCN) of weather stations so they aren’t used in the official temperature indexes for monitoring climate. The paper compares the actual temperature differences in °C between rural and urban site after making adjustments for elevations and latitudes. Peterson claimed there was an insignificant difference between the temperatures of urban and rural sites. The temperature indexes are based on the temperature anomalies of each site, so only the temperature trends in °C/decade are used. The actual temperatures are irrelevant. McIntyre wrote “It’s hard to see exactly what a comparison of the left column [Urban] sites and right column [Rural] sites has to do with whether the urbanization affects the CRU, NOAA or GISS composites.”
McIntyre calculated the temperature trend difference between Peterson’s rural and urban station sites and found it to a highly significant trend of 0.05 °C/decade. He also found the trend of a group of 12 sites at cites to be 0.2 °C/decade greater that the rural sites. The same Peterson was the lead other of the other referenced paper (Peterson & Owen 2025). That paper concluded “Whether a UHI signal was found depended on the metadata used.” I show that the rural sites are contaminated by the UHIE. The greatest increase in temperature due to a population increase is at the lowest populations or population densities. I also show that the urbanization correction applied to the NASA’s GISS temperature index fails to remove the UHIE.
Radiation Transport in Clouds
Professors W. van Wijngaarden and W. Happer published a paper this year that reviews the dominant role of clouds in Earth’s climate. Clouds have a dramatic effect on the amount of shortwave sunlight radiation reaching the Earth’s surface. Longwave radiation from the air and clouds to the Earth, called downwelling thermal radiation, has wavelengths greater than 4.2 micrometers. There is a large difference of downwelling thermal radiation between clear and cloudy weather, with close to 340 W/m2 from cloud bottoms on overcast days and around 260 W/m2 in clear weather. Radiative transfer theory shows that doubling the concentration of carbon dioxide, for a cloudless sky only decreases radiation to space by 1%. The paper concludes that an increase in low cloud cover of only about 1% could largely compensate for the doubling of CO2.
Volcanic CO₂ Emissions Could be Three Times Higher than Anticipated
This article summarizes research that found conventional measurements of volcanic CO2 emissions might by underestimated threefold. Scientists have developed an advanced sensor that can detect volcanic gases with rapid speed and precision. The research team measured emissions at a volcano on the Caribbean Island of Montserrat using the new sensor mounted on a helicopter. The measurements show that the volcano emitted three times more CO2 than earlier studies had estimated. Previous studies focus on hot vents which release high concentrations of volcanic gases. However, many volcanoes have cooler hydrothermal vent systems that absorb the acidic gases, making them harder to detect. As a result, CO2 emissions from these cooler sources are often overlooked. The typical CO2 flux calculation of multiplying CO2/SO2 ratio measured at hot vents with SO2 flux underestimates total CO2 flux. The cold vents release gases at much lower CO2/SO2 ratios. The CO2 flux was 15 to 41 kg/s from hot fumaroles and 61 to 131 kg/s for the overall plume. The article says “The new technology exposes those hidden emissions, offering a more accurate quantification of the volcano's gas output. … Volcanoes still contribute less than 5% of global CO2 emissions, far less than human activities such as fossil fuel combustion and deforestation." The new technology could enhance early warning systems of impending volcanic eruptions.
Sea Ice Pattern Effect on Earth’s Energy Budget Is Characterized by Hemispheric Asymmetry
This paper investigates the Earth’s global radiative effect of changes in sea ice concentration (SIC) spatial distribution. The authors show that SIC-induced radiation anomalies at the top of the atmosphere are sensitive to the location of SIC reduction in each season. Computer model experiments suggest that SIC-induced surface warming is greater in the Arctic than in the Antarctic region. Less sea ice in the Arctic causes more cloud cover and a negative cloud feedback in the Arctic. The sea ice area and SIC reduction is significant in the Arctic, while there is no significant trend in annual mean Antarctic sea ice area during 1979-2018.
The actual pattern of SIC is different from the simulated CO2-induced global warming. The paper says “Unexpectedly, the trend of global change in ∆R is negative despite the statistically significant decrease of global SIC between 1980 and 2008, implying that global SIC reduction leads to planetary cooling during this period.” ∆R means the change in the top of the atmosphere radiation flow induced by a change in SIC, where positive ∆R causes warming. During this period, Antarctic SIC increases leading to a decrease in ∆R in the Antarctic region while Arctic SIC decreases leading to an increase in ∆R in that region. The sensitivity of ∆R in the Arctic to SIC changes is smaller than that in Antactica, so the cooling effect of increasing Antarctic SIC is greater than the warming effect of decreasing Arctic SIC. The paper says “As a result, the relationship between global SIC trend and ΔR trend is opposite from that under long- term global warming, and the sea ice pattern effect is important in determining the climate effect of sea ice cover changes.” Also see here.
The Post-1980s Warming Trend Has Improved European Life Expectancy
Warming is good, cooling is bad for humans and animal. This study examines how climate conditions influence life expectancy in Europe based on the impact of year-to-year temperature variability adjusted for economic changes. Life expectancy changes are linked to economic output. Milder than usual winters are linked to a reduced number of hospitalizations and lower mortality rates. The authors developed a model to disentangle the concurrent processes of economic development and climate change. Local temperature variations were characterized by heating degree days (HDD) and cooling degree days (CDD) above and below base temperatures. The calculations took into account variations in alcohol and tobacco consumption, and the gender-specific effects of social inequalities.
As expected, an increase of gross domestic product (GDP) per capita increased life expectancy by 0.41 years per 1000 Euros/capita. The impact of below optimal temperature was large. Annual 1000 HDD reduces life expectancy by 3.0 years and annual 1000 CDD reduces life expectancy by 2.4 years. Each of these three effects is reduced by a small logarithm term. In cold regions, the reduction of life expectancy reached 24 months. Conversely, the loss of life expectancy due to temperatures above the optimum was only discernible south of the Alps where it was at most 8 months. The most favorable regions for life were those with warm winters, yet moderated summer temperatures due to proximity to the sea. The difference in life expectancy due to climate reasons between the harshest and most benign regions was 19 months.
The change in life expectancy due to temperature change from the 1979–1982 average to the 2019–2022 average was calculated. Paradoxically, the highest gains were observed in regions that were already warm, amounting to up to 3 months. Some regions of Scandinavia actually would experience no change of life expectancy. Even after controlling for economic growth, a modest warming trend appears to offer a moderate benefit from the perspective of life expectancy. The authors suspect that economic growth contributes to gains in life expectancy partially by enabling adaptations to adverse climate conditions.
CliSci # 427 2025-03-16
Variable Vertical Land Motion and its Impacts on Sea Level Rise Projections
A new paper published in Science Advances provides new estimates of vertical land movement over California using high-resolution satellite data. The paper criticizes the IPCC’s 6th assessment report for relying on regional linear estimates of vertical land movement (VLM). This can result in over or under estimates of sea level rise relative to land. Nonlinear VLM, driven by factors such as hydrocarbon and groundwater extraction, can increase uncertainties in 2050 projections by up to 0.4 meters in certain areas of Los Angeles and San Diego. The paper’s abstract concludes “This study highlights the critical need to include local VLM and its uncertainties in sea level rise assessments to improve coastal management and ensure effective adaptation efforts.”
Global Navigation Satellite System (GNSS) stations provide precise measurements of land movement but the global coverage is uneven, leaving large gaps that miss areas with large magnitude VLM. Interferometric Synthetic Aperture Radar (InSAR) provides high spatial resolution estimates of VLM over large areas that can fill these gaps. The results confirm widespread tectonic land uplift of 1 to 3 mm/yr in northern California and subsidence around San Francisco and San Diego associated with the San Andreas Fault system over the period 2015-2023. Land subsidence rates of 5 mm/yr are found in parts of the San Francisco Bay, which is far greater than absolute sea level rise. Extraction of groundwater and the recharge of aquifers lead to variable surface responses. The paper says “Beside updating projections, InSAR-VLM time series can also assist in timely adaptation efforts, especially if VLM trends overly shift downward at certain times, leading to increased exposure to sea level rise.
Lightning Strikes Declines by over 40% over Shipping Lanes After Shipping Industry Cut Sulfur Emissions
Authors of a new paper used the recent 7-fold reduction in allowable ship fuel sulfur emissions to investigate the decline of lightning strikes along busy maritime shipping lanes in the tropical Indian Ocean and South China Sea. Maritime ship traffic leads to the emission of aerosol particles and associated precursors into relatively clean marine air. In January 2020, the International Maritime Organization (IMO) reduced the amount of allowable sulfur in fuel from 3.5 % to 0.5 % to curb effects of maritime shipping on air pollution. Previous work documented the enhancements of lightning over major shipping lanes as ship traffic gradually increased. Since January 2020, lightning over shipping lanes have fallen by over 40%. Observations of droplet number at the cloud base show a similar decline over the shipping lane. There is little consensus on the mechanisms or magnitudes of aerosol particle impacts on deep convective cloud systems. The abstract says “These results have fundamental implications for our understanding of aerosol–cloud interactions, suggesting that deep convective clouds are impacted by the aerosol number distribution in the remote marine environment.”
Several mechanisms have been proposed to explain how aerosol particles from ship emissions could enhance lightning frequency, all of which involve enhanced cloud droplet nucleation. One theory is that enhanced nucleation leads to changes to super-cooled liquid water and ice distributions and enhanced charge separation in the mixed-phase region of convective clouds. Another theory suggests that enhanced nucleation leads to an increase in the frequency or intensity of deep convection due to changes in the vertical distribution of humidity.
Medieval Warm Period Undeniable, Pronounced In Antarctica and Poland
Pierre Gosselin wrote this article that summarized two recent papers that show a pronounced Medieval Warm Perion in Antarctica and Poland. He wrote “The Medieval Warm Period, the natural warm phase between 700 and 1300 AD, cannot be reproduced by climate models because the simulations react primarily to CO2. Back then CO2 was not a factor because its concentration level in the atmosphere was pretty much constant. That’s why people would rather keep the Medieval Warm Period quiet.”
One paper reports on the historical changes in penguin population in the Ross Sea region of Antarctica. The researchers analyzed sediment cores from abandoned penguin colonies and reconstructed the changes in the populations of penguins over the past 1500 years. They found that the penguin population peaked between 750 and 1350 AD, possibly due to habitat expansion in a warmer climate during the Medieval Warm Period. The population trend also coincided with extreme swings in the El Niño and Southern Annular Mode atmospheric-ocean circulation patterns. These circulation patterns could increase the influx of nutrient-rich water, increasing the penguin population.
The other paper reported on four new reconstructions that the authors created from tree ring data and from biological proxies. The researchers also studied existing climate reconstructions that have been produced for Poland in the last two decades. The Medieval Warm Period probably occurred in Poland from the late 12th century to the first half of the 14th or 15th century. All analyzed quantitative reconstructions indicate that the Medieval Warm Period in Poland was comparable or even warmer than the average temperature in the period 1951-2000. The two new studies from Antarctica and Poland indicate that the natural climate factors still need to be much better understood in order to be able to incorporate them faithfully into climate models.
Trial of Mann v. Steyn: Post-Trial Motions Edition
Penn State climate “scientist” Michael Mann brought a lawsuit for defamation against Mark Steyn and Rand Simberg, as well as against two websites; National Review and CEI in 2012. Menton wrote, “Mann asserted that his reputation had been damaged by the Steyn and Simberg posts, which had compared Mann to fellow Penn Stater Jerry Sandusky. The point of comparison was that Penn State had investigated and cleared both men around the same time over allegations of misconduct — scientific misconduct in the case of Mann, sexual misconduct in the case of Sandusky.” National Review and CEI were dismissed from the case before the trial started. The case finally reached trial in January 2024 against Steyn and Simberg as defendants. The jury awarded $1 of compensatory damages against each defendant and awarded punitive damages of $1000 against Simbert and $1 million against Steyn. On January 10, 2025, Judge Irving ruled that Mann must pay National Review $530,820 for recovery of attorneys’ fees and costs. On March 4 Judge Irving reduced the punitive damages award against Steyn from $1 million to $5000.
Mann’s claim for damages was based on the theory that he lost government research grants due to the alleged defamatory blog posts. He claimed that he lost a $9 million grant, but later amended that amount to only $100,000 shortly before the trial. Mann said he realized that if the grant was won, most of the $9 million would have gone to institutions other than Penn State. Mann’s lawyers had maneuvered to get the $9 million dollar figure into an exhibit that would go before the jury, when they knew that that figure had been withdrawn as wrong. The remedy for this misconduct will be a monetary award to the defendants of the amount spent to deal with Mann’s misrepresentation. The Judge will make a decision of the award after reviewing presentations from the defendants. Menton guestimates it will be tens of thousands to $100,000.
The defendants put on substantial and definitive evidence of the flawed “science” in Mann’s Hockey Stick reconstructions — manipulation of data, incorrect error bands, suppression of adverse verification statistics, and so forth. Mann’s lawyer completely ignored this entire issue on their rebuttal case. The jury ignored the issue of fake science.
“Extreme Heat” Isn’t Accelerating Aging—And It’s Not Getting Worse
Several news sources have posted articles claiming that extreme heat may speed aging and increase the risk of diseases. This article by Anthony Watts says this is false and misleading. The story is based a study that claims that the authors are able to detect age enhancing DNA changes from blood tests done on older populations. They provide a map of the United States showing areas of heat risk days above 90 °F (32 °C). Watts wrote “However, data from Climate at a Glance shows that heat waves in the U.S. were far more severe in the 1930s, particularly during the Dust Bowl years, than anything we see today. NOAA’s temperature records confirm that the highest recorded temperatures and longest-lasting heat waves occurred nearly a century ago. If ‘extreme heat’ were truly an escalating crisis, we would see a consistent upward trend in heat wave frequency and intensity, but that is simply not the case.” The study also ignores the urban heat island effect, which has grown over the last several decades as cities populations increase. The study wrongly assumes that increased temperatures are the only reason for these aging changes in the DNA of people they studied. Several other environmental and personal factor contribute to faster aging, including UV radiation, diet, physical activity, poor air quality, obesity, and smoking. The study doesn’t take any of these into account, leading to a conclusion that cannot be verified as being only temperature related. The study only used data from 2010 to 2016, which is far too short to relate to climate change. The study ignored the dangers of cold weather. This study found that cold-related deaths vastly outnumber heat-related deaths worldwide, by nearly a 10-to-1 margin.
CliSci # 426 2025-03-02
Friends of Science Speaking Event and Book Launch
Common Sense on Climate and Energy: Let's Nix Net Zero – Together
March 11, 2025 – 7PM, Calgary, Alberta
Join us in-person or online for this live event which combines our formal Book Launch with a speaking event by two of the key authors of “Energy & Climate at a Glance.” Published by Canadians for Sensible Climate Policy (CSCP) and The Heartland Institute, this is the handy guide-book that Friends of Science Society has been promoting over the past month.
Lead author Ron Davison, P. Eng. and contributing author Paul MacRae will be presenting a synopsis of their work.
Ron Davison will open your eyes on the Paris Agreement, Net Zero and ‘the science’ of climate change in his talk titled: Net Zero – Climate Policy is All Pain, for Minimal Gain!
Paul MacRae will be discussing Why We Can’t Abandon Fossil Fuels, and Why We Shouldn’t Try.
Check out our event page for more information and to purchase tickets.
Tickets are $20 for Friends of Science members and $25 for non-members.
Ticket sales are ongoing until March 11th, while supplies last - No tickets will be sold at the door. Purchase your tickets today!
Paleo-Storm Reconstruction from Eastern Canada Aligns with Atlantic Hurricane Records
Storm records on millennial time-scales along the Atlantic coast of North America are scarce. This study published this month uses grain-size and geochemical data from cores drilled into two peatlands in Quebec’s Magdalen Islands. These Islands are an archipelago in the Gulf of St. Lawrence, located between Prince Edward Island, Anticosti Island and Cape Breton Island. Most previous studies utilized overwash deposits that result from the combination of storm surge and waves overtopping barrier beaches and are deposited in the backbarrier environments.
The two peat records reveal consistent storm signals over the past 4000 years. Three periods of heightened storm activity are 800–550 BCE, 600–800 BCE, and 1300–1700 CE. These periods align with overwash records of the past 2000 years across eastern North America. Storm activity was low during the Medieval Warm Period and high during the Little Ice Age. The negative phase of the Atlantic Multidecadal Oscillation are associated the greater storm and hurricane activity. The study found a potential antiphase relationship in storm activity between the region north of the Bahamas and in the Gulf of Mexico.
The study shows that there is greater storm activity during cooler times and less storm activity during warmer time. This is opposite to the assumption utilized in integrated assessment models used to calculate the impacts of warming of storm damages and the social cost of carbon dioxide.
Recent Decline in Global Ocean Evaporation Due To Wind Stilling
Accurately understanding changes in the hydrological cycle has profound implications for forecasts of climate change. Climate models assume that evaporation and precipitation will both increase in a warming world. Evaporation is the largest component of the global hydrological cycle. Basic physics show that evaporation rates tend to increase as the water heats up. However, climate science is much more complicated than basic physics. This recent paper reports that there has been a slowdown in the growth of global water vapor since roughly 2000s. This study used satellite‐based ocean evaporation estimates to explicitly quantify and attribute the global ocean evaporation (Eo) tendencies in different periods. The abstract say “Our findings are unexpected: despite rising sea surface temperatures, global Eo has decreased in the most recent decade. This phenomenon is due primarily to the reduction in wind speed, likely linked to changes in atmospheric circulation patterns associated with Earth's decadal climate variability. These results offer a deeper understanding of the complex ways climate change is reshaping the planet's water cycle.”
The global averaged annual Eo of four satellite products increased significantly at a rate of 3.4 mm/yr2 during 1988–2017. Positive trends were in 91% of the oceans. However, the Eo trend analysis shows a significant touring point at 2008. The Eo trend during the period 1988-2008 was +5 mm/yr2. After 2008 the Eo trend decreased to negative 1.5 mm/yr2. The paper says “This reversal, evident in the MEM of four satellite products, is robust, as similar contrasting tendencies are also observed in each individual satellite product”. During 2008–2017, approximately two‐thirds of the global ocean experienced declines in Eo.
Starting a Better Climate Conversation with Bjorn Lomborg
Bjorn Lomborg has teamed up with the Fraser institute to publish a series of 10 weekly articles in Canada’s National Post on climate and climate policy. The first article was published on Febuary 25th. Bjorn Lomborg is a political scientist and the Director of the Copenhagen Consensus Center and Visiting Professor at Copenhagen Business School. He researches the smartest ways to help the world and is best known for his books The Skeptical Environmentalist and Cool It. Bjorn Lomborg is no climate skeptic as he apparently believes the IPCC’s narrative on climate sensitivity. He wrote that “Global warming is a real problem. Climate economics has shown how this brings … more problems than benefits.” Friends of Science dispute this. Lomborg says the climate policies force people to use much more expensive energy, slowing economic growth. He shows that the climate-related global deaths have declined from about half a million per year in the 1920’s to less than 10,000 per year despite a growing population, which is a decline of 97.5%. The risk of clime-related death has declined by more than 99%. Costly climate policies in the United Kingdom (UK) have caused electricity prices to increase in real terms from 1994 to 2023 by a factor of 2.9. The electricity price in the USA over the same period has increased by only 10%. Prices are weighted average residential and industry electricity.
Humans, Not Climate Change, May have Wiped Out Australia’s Giant Kangaroos
The demise of most of Australia’s kangaroo species by 40,000 years ago may have had less to do with climate-caused dietary pressures and more to do with human hunters. Between 65,000 and 40,000 years ago, more than 90 percent of Australia’s large animal species went extinct. Over half were kangaroos. The common narrative was that the extinction of the giant kangaroos was due to both the arrival of humans and climate change which was thought to have dramatically reduced the animals’ dietary options. This article which summarizes a new paper shows that the changing climate theory doesn’t make any sense. To assess the possible role of dietary restrictions caused by the changing climate, scientists analyzed the teeth of 937 kangaroos, both fossilized and modern, studying tiny signs of wear and tear that point to what the creatures ate. The analysis suggests the long-gone kangaroos were generalists, consuming a variety of foods that would have helped them survive as the climate changed. Human hunters are the likely cause of the extinctions, not climate change.
Urban Heat Island and Why Location Matters
Ray Sanders wrote this article demonstrating that the location of surface temperature stations in England, U.K. does indeed matter. He compares simultaneous temperature reading at many temperature stations to their surroundings. The stations surrounded by built-up areas have significantly higher temperature that those stations with natural land surfaces. Sanders presents a map of the west London. The temperature stations are identified with green circles with numbers indicating the temperatures in °C. Sanders wrote “The headline image of west London shows the Battersea site (Class 5 just west of Brixton) reading 9°C whilst simultaneously Kew Gardens ( Class 2, north of Richmond) was reading 5 degrees colder at just 4°C. Moving further west, Heathrow (Class 3) rises again by 3 degrees to 7°C.” The class number represents the siting of the station, with class 1 meaning natural surrounds and class 5 represents the worst siting with urbanized surroundings. “It is beyond any reasonable debate that these above variations are not in any way representative of natural phenomena. Clearly these represent the known Urban Heat Island effects identified by official research. The sudden temperature increase surrounding Heathrow demonstrates the result of locating one of the world’s busiest and largest international airports there.” Several other examples are presented showing large temperature variation corresponding to the class ratings. The implication of the analysis is that the official temperature record is corrupted by the urban heat island effect.
CliSci # 425 2025-02-18
The Ronne Ice Shelf Survived the Last Interglacial
The projected melting of the West Antarctic Ice Sheet (WAIS) is the largest cause of uncertainty in long-term sea-level rise. The range of projections of future sea-level contributions from Antarctica for a given climate scenario is large. A new study published in Nature used the Skytrain Ice Rise (SIR) ice core data to show that the Ronne Ice Shelf was “close to its current extent” during most of the last interglacial (LIG) around 125,000 years ago. The sea level was several metres higher during the LIG than today. Antarctica and the Southern Ocean were warmer than today. SIR is an ice cap, independent from the main body of WAIS, that sits at the landward margin of the Ronne Ice Shelf adjacent to WAIS. SIR is expected to have remained an independent ice cap throughout the last glacial cycle because it is separated from the main ice sheet. Sodium (Na) is used as a sea salt indicator in the ice core record. Sea salt is transported and deposited to ice sheets from the saline surfaces of sea ice and the open ocean. To reach SIR, sea salt must travel from the ice front across the non-marine Ronne Ice Shelf, whose front is now 680 km from the drill site. Therefore, the salt concentration in the ice core is a proxy for the distance from the ice shelf edge to SIR.
The paper’s abstract says “Water isotope data are consistent with a retreat of WAIS, but seem inconsistent with more dramatic model realizations in which both WAIS and the large Antarctic ice shelves were lost. This new constraint calls for a reappraisal of other elements of the LIG sea-level budget. It also weakens the observational basis that motivated model simulations projecting the highest end of projections for future rates of sea-level rise to 2300 and beyond.”
Climatic Model Precipitation Simulations are Unreliable
A new paper by Demetris Koutsoyiannis discusses several metrics for measuring the appropriateness of a model by testing models against reality. The paper compares precipitation simulations of 37 climate models against reality as represented by the ERA5 reanalysis, where ERA refers to ECMWF ReAnalysis. Graphs were constructed for the period 1940 to 2023 separately for the North Hemisphere (NH) and the South Hemisphere (SH) on an annual precipitation rate and on an 8-year average precipitation rate. The graphs below shows the 8-year average of the climate model precipitation (thin lines) compared to the ERA5 data (thick lines) for the NH (left) and the SH (right).

The graphs show the large bias of the models, which is mostly negative for the NH and mostly positive for the SH. The paper says “Different models have largely different biases, which in most of them are very large. The large bias in precipitation certainly reflects the inappropriate modeling of the physical processes related to the hydrological cycle, starting with latent heat and evaporation. Nonetheless, Figure 7 shows that on a hemispheric basis, there is a correlation between models and reality, with an average of 0.31 for the NH and 0.11 for the SH. An interesting property is that each model’s precipitation at the NH is negatively correlated to that of the same model for the SH, with an average correlation of −0.61 for zero lag. This model property, however, does not correspond to reality: if this correlation is estimated from the ERA5 data, it is practically zero (−0.03).” The precipitation simulated by the climate models does not agree with reality on the annual scale, but there is some improvement on larger time scales on a hemispheric basis. “[W]hen the areal scale is decreased from hemispheric to continental, i.e., when Europe is examined, the model performance is poor even at large time scales.” Therefore climate models are not useful for hydrological purposes.
Biases in Snowfall and Cloud Phase in ERA5 and CMIP6 using Satellite Observations
This new study shows that a major reanalysis dataset and climate models do a poor job at simulating snowfall and clouds. Super-cooled liquid-containing clouds (sLCC) and snowfall from these clouds play a major role in Earth's radiative budget. The study found that the ERA5 reanalysis and 10 CMIP6 climate models consistently overestimate the frequency of sLCC and snowfall frequencies from sLCC compared to CloudSat–CALIPSO satellite observations. The abstract says “The biases are very similar for ERA5 and the CMIP6 models, which indicates that the discrepancies in cloud phase and snowfall stem from differences in the representation of cloud microphysics rather than the representation of meteorological conditions.” These sLCC dominate at latitudes higher than 45° and cover up to 20 %–30 % of the Earth, depending on the season. Super-cooled water droplets and ice crystals coexist at temperatures between −40 and 0 °C. A cloud with more liquid reflects more solar radiation back to space. Therefore, representing the cloud phase correctly in climate models has substantial implications for the estimate of the cloud feedback and future climate projections.
Two satellites, CloudSat and CALIPSO, CALIPSO have provided global estimates of cloud properties and snowfall since 2006. Both ERA5 and the CMIP6 mean overestimate the fraction of sLCC during all seasons. The most significant discrepancy is observed during boreal spring, with area-weighted-average differences between CloudSat–CALIPSO and ERA5 and the CMIP6 model mean of −11 % and −14 %, respectively. Interestingly, models with more sophisticated microphysics schemes do not necessarily perform better. In contrast to the CloudSat–CALIPSO observations, both ERA5 and the CMIP6 model mean have much higher frequency of snowfall from sLCC values (> 60 %). In regions where all three datasets have sLCCs, ERA5 and the CMIP6 model mean overestimate the frequency of snowfall from sLCC by ∼50 %. This indicates that ERA5 and the CMIP6 models produce snowfall much more frequently from sLCCs than observed.
Extended Crop Yield Data Do Not Support Upward SCC Revision
The Biden Administration raised its Social Cost of Carbon (SCC) estimate about fivefold based in part on projections of declining crop yields using a dataset published in 2014. The dataset didn’t include all relevant variables, usually changes in CO2, in about half of the 1722 records. Dr. Ross McKitrick reexamined the data and recovered 360 records with CO2 changes, increasing the sample size from 862 to 1222. McKitrick used multivariate regression modeling on the larger dataset and found that global average yield changes are positive out to 5 °C warming from 1900. The variables required for the analysis are changes in crop yield, CO2 levels, temperature and precipitation for several crop types. The agricultural component of the upward revised SCC was based on an analysis of the data by Moore et al. 2017 (M17). That analysis failed to include the CO2 fertilization effect in almost half of the records.
The M17 analysis imposed too severe diminishing marginal gains of CO2 fertilization. M17 presented graphs of yield effects from temperature change alone, excluding the offsetting effect of CO2 fertilization and adaptation. CO2 fertilization increases crop yields and increases crop’s water use efficiency. Farmers adapt to warming by changing to heat-resistant crop strains. The negative temperature effects are fully offset by gains from CO2 fertilization and adaptation. McKitrick wrote “Overall I conclude that climate change-related agricultural damage estimates in M17 are too pessimistic and the large implied revisions to the SCC are unsupported.”
A fire Deficit Persists Across Diverse North American Forests
This new study evaluated the burned area across North American forest in recent decades and pre-1880 historical times. The study found that a widespread fire deficit persists in recent decades across a range of forest types compared to historical fire regimes (pre-1880). The authors used the North American tree-ring fire-scar network (NAFSN), a multi-century record comprising >1800 fire-scar sites spanning diverse forest types and contemporary burned area data to determine the fire deficit. Despite recent increasing burned areas, they are not unprecedented considering the multi-century perspective offered by fire-scarred trees.
The paper says that wildland fire was common and widespread across many forests and woodlands in North America prior to the late 19th and early 20th centuries. In subsequent decades the practice of preventing and suppressing nearly all wildland fires resulted in a large decrease in average annual burned area up to the 1980s. The burned area has increased since the mid-1980s in parts of North America. Fire proxies from charcoal preserved in lake sediments and bogs suggest that there is considerably less area burned in the 20th century compared with previous centuries. Tree-ring fire-scar records provide annually resolved, site-specific information on fire occurrence. All analyses were conducted across NAFSN sites in the United States and Canada and by ecoregion forest types.
Based on the historical fire-scar record, NAFSN sites collectively would be expected to have burned 4346 times from 1984–2022, yet they burned 989 times, or only 23% of what would be expected under the historical fire regime. In all ecoregions except the Taiga & Hudson Plain, NAFSN sites exhibit a statistically significant fire deficit from 1984–2022. A statistically significant fire surplus was observed from 1984–2022 in the Taiga & Hudson Plain ecoregion, which is the forest region of northern Canada. Individual years with particularly widespread fire during the 1984–2022 period were not unprecedented in comparison with the active fire regimes of the historical period across most of the study region. In many western North American forests, particularly those represented by the tree-ring fire-scar sites analyzed, heavy fuel loads and increased fuel continuity have developed because of fire suppression, thereby increasing fire severity (the proportion of trees killed by fire) when forests inevitably burn.
CliSci # 424 2025-02-02
Rising Carbon Dioxide is Making the World's Plants more Water-wise
This study finds that as plants grow faster in response to rising carbon dioxide (CO2) they aren’t using more water to do it. This is excellent news as it shows that economic models used to justify carbon taxes are wrong to forecast economic cost to changes in water availability. This article about the study says “The globe is greening as plants grow faster in response to rising carbon dioxide. But a new analysis shows they aren't using more water to do it.” The study reports that land plants absorbing 17% more CO2 from the atmosphere than 30 years ago but are not using more water. The study says “Our confirmation of a global trend of increasing water use efficiency is a rare piece of good news when it comes to the consequences of global environmental change. It will strengthen plants’ vital role as global carbon sinks, improve food production, and might boost water availability for the well-being of society and the natural world. … We found that across the globe, boreal and tropical forests are particularly good at increasing ecosystem water use efficiency and uptake of CO₂. That is due in large part to the CO₂ fertilisation effect and the increase in the total amount of leaf surface area.”
Truths about Coral Bleaching: CO2 Warming vs Reduced Clouds Cover?
Jim Steele explains in this article that reduced cloud cover is the primary cause of coral bleaching. Cora reefs evolved 240 millions years ago when they formed a marvelously fluid symbiotic relationship with symbiodinium algae. At that time global average temperatures were about 14 °C higher than now. The algae symbionts absorbed CO2 and produced sugars via photosynthesis for the coral. In turn coral respiration produced CO2 that supported the algae’s photosynthetic production. Shallow-water coral are now restricted to the warmest ocean waters. Increased sunlight produces excessive dangerous Reactive Oxygen Species (ROS) like hydrogen peroxide during the light reactions of photosynthesis. Thus, many corals threatened by increasing ROS, have adopted the survival strategy of ejecting their mal-adapted algae (i.e. bleaching). Coral can re-absorb those algae later when the extreme light conditions subside or absorb new symbiodinium algae adapted to the higher light conditions. The major factor affecting solar insolation is changing cloud cover associated El Nino-La Nina oscillations. Changes in the sun’s insolation primarily drive bleaching by increasing ROS production during photosynthesis along with solar heating. In 2022 the Australian Institute of Marine Science (AIMS) reported the highest levels of coral cover across two-thirds of the Great Barrier Reef (GBR) in over 36 years.
Climate Change Isn’t Disrupting the Polar Vortex
Numerous mainstream news outlets have falsely claimed that the January record cold in the United States was caused by climate change disrupting the polar vortex, allowing cold air to break out of the Arctic into mid-latitudes. This article shows there is no solid evident to support these claims. The polar vortex is a low-pressure system in the stratosphere at 10 km to 50 km altitude that forms over the polar regions during the winter. Its strength is influenced by the natural variability like the North Atlantic Oscillation and ENSO. A change in the polar vortex can cause a similar change in the polar jet stream, which is in the troposphere at 8 km to 14 km above the surface. However, many Arctic cold air outbreaks happen without any change to the polar vortex, and sometime a disrupted polar vortex causes no change to the lower troposphere weather. There is no consistent trend in the frequency or intensity of polar vortex disruptions over the past several decades. The article states “Cold outbreaks similar to the current one have been documented regularly over the past two centuries, at least, including the brutally cold winters of the late 19th and mid-20th centuries.” A recent study found no statistically significant increase in jet stream waviness or meandering in recent decades. Climate models can’t reliably predict polar vortex behaviour in a warming world; some models predict warming will lead to a stronger polar vortex and others predict the opposite.
Strong to Violent Tornadoes Frequency Decline 59% over 69 Years
Over the years, the ability to observe and measure tornadoes has greatly increased. NOAA said “If a tornado occurs in a place with few or no people, it is not likely to be documented. Many significant tornadoes may not make it into the historical record since Tornado Alley was very sparsely populated during the 20th century. Today, nearly all of the United States is reasonably well populated, or at least covered by NOAA’s Doppler weather radars. Improved tornado observation practices have led to an increase in the number of reported weaker tornadoes …” The Enhance Fujita (EF) scale is a scale for rating tornado intensity, based primarily on the damage tornadoes inflict on human-built structures and vegetation. NOAA doesn’t publish graphs on its website of tornado counts by EF scale rating. It only shows the tornado count of all tornadoes, including the very weak EF0 and EF1, giving a very misleading impression of increasing tornado frequency. EF0 tornadoes have wind speeds as low at 100 km/h. The linear trend of reported EF0, EF1 and EF2 tornadoes 1955 to 2024 are +95, +26.5 and -16.3, respectively.
A graph of strong to severe (EF3-5) tornadoes from 1955 to 2024 is shown below. The best fit linear trend shows a significant declining trend of -53%. The tornado count decline is 5.3 tornadoes per decade. The data 1955-2023 is from NOAA's Storm Prediction Centre. 2024 data is preliminary.

This stacked bar graph shows the EF scale EF3 (220–265 km/h), EF4 (270–320 km/h) and EF5 (> 320 km/h) tornado counts. The declining linear trends of the intensity categories are; EF3 -4.04, EF4 -1.12, and EF5 -0.17 tornadoes/decade.
Detected Surface Solar Radiation Brightening in Europe
This paper used satellite date to find that Europe has experienced an increase in surface solar radiation, termed “brightening,” since the 1980s. Analyzing 61 locations distributed across Europe from 1983 to 2020, aerosols emerge as key driver of the solar brightening during 1983–2020. Cloud effects exhibit spatial variability, inducing a negative effect on surface solar radiation in the same period. In the period 2001–2020, aerosol effects are much smaller, while cloud effects dominate the observed brightening (2%/decade–5%/decade). The study therefore finds a substantial decrease in cloudiness over Europe in the first two decades of the 21st century.
This study compared various satellite surface solar radiation products against in-situ measurements over Europe. All products show an increase in surface solar radiation, or brightening, over the last 40 years over Europe. The brightening trends differ mostly due to different aerosol modeling approaches used by each product. Both the reduction of aerosols and the reduction of cloud cover since 2001 caused solar brightening in Europe, contributing to global warming.
Ottawa’s “Net Zero” emission-reduction plan will cost Canadian workers $8,000 annually by 2050
A new study by Dr. Ross McKitrick for the Fraser Institute provides an outlook through 2050 of Canada’s path to net zero by answering two questions: will the Government of Canada’s current Emission Reduction Plan (ERP) get us to net zero by 2050, and if not, is it feasible for any policy to get us there? First, a simulation of the ERP extended to 2050 results in emissions falling by approximately 70% relative to where they would be otherwise, but still falling short of net zero. The costs are huge: real GDP declines by 7%, income per worker drops by 6%, and the annual cost per worker exceeds $8,000. Second, at $400 per tonne, emissions decrease by 68%, but tripling the carbon tax to $1,200 per tonne achieves only an additional 6% reduction. At this level, the economic impacts are severe: GDP would shrink by 18%.
Correction to CliSci # 423
The article “NASA Space Mission Shows Canada Net Removal of CO2 is the World’s Largest” in CliSci # 423 had an incorrect date range of the data in two sentences and the table heading. The correct date range is 2015-2020. The fifth sentence should read “So Canada caused a net CO2 removal of 960 MtCO2/yr from the atmosphere over 2015-2020.” This was corrected on the website.
CliSci # 423 2025-01-21
NASA Space Mission Shows Canada Net Removal of CO2 is the Worlds Largest
An international team of scientist has calculated the net CO2 exchanges with the atmosphere of 187 countries, including the biomass exchanges due to photosynthesis and fires. The estimates are based on both in situ CO2 observations from NOAA and NASA's Orbiting Carbon Observatory-2 satellite data. The average 2015-2020 Canadian CO2 emissions from fossil fuels and cement production were 620 megatonnes CO2 per year (MtCO2/yr). However, Canada's biosphere absorbed a net 1,580 MtCO2/yr, which are 2.5 times our CO2 emissions. So Canada caused a net CO2 removal of 960 MtCO2/yr from the atmosphere over 2015-2020. Canada's net CO2 removal from the atmosphere is significantly greater than any other country. By contrast, China caused at net CO2 addition of 7,860 MtCO2/yr over the same period. The table below shows the CO2 emissions net of CO2 biomass absorption of countries with the three most negative and three most positive emissions.
| Country |
Net CO2 Emissions
ave. 2015-2020 (MtCO2)
|
| Canada | -960 |
| Russia | -793 |
| Peru | -793 |
| India | +1,836 |
| USA | +3,478 |
| China | +7,860 |
Glacier Experts Uncover Critical Flaw in Sea-Level Rise Predictions
A new study shows temperate glacier ice flows more steadily than previously thought, leading to lower projections of sea-level rise. A co-author of the study explains that glaciers contain two types of ice; some ice called temperate ice is at their pressure-melting temperature and is soft and watery, like an ice cube melting on a kitchen counter, while other parts of glaciers have cold, hard ice, like an ice cube in a freezer. The hard ice characteristics are used as the basis of glacier flow models and forecasts. The new paper describes lab experiments that suggest a parameter of a glacier flow equation should be changed for temperate ice. The ice experiments used a ring-shear device with a hydraulic press than can apply 100 ones of force on the ice to simulate the weight of a glacier 800 feet thick. Ice is temperate near the bottoms and edges of the fastest-flowing parts of ice sheets and in fast-flowing mountain glaciers. Previous experiments were mostly done on hard, cold ice which showed a power function relationship between ice stress and its deformation rate. Temperate ice is linear-viscous over common ranges of stress expected near glacier beds. The paper’s abstract says “This linearity is likely caused by diffusive pressure melting and refreezing at grain boundaries and could help to stabilize modeled responses of ice sheets to shrinkage-induced stress increases.” Using the new values will lead to significantly lower projections of glacier flow with global warming leading to lower forecasts of sea-level rise.
Northern Hemisphere Hurricane Intensity Significantly Declines in 2024 despite Alarmist Hype
The Northern Hemisphere data for the 2024 hurricane season shows that the accumulated cyclone energy (ACE) was 455 as compiled by the Colorado State University, which is only 78.6% of the 30-year 1991-2020 average of 579 as show in this graph. The ACE accounts for the intensity and duration of all tropical storms and hurricanes. The highest ACE since 1990 was 880 in 1992, nearly double the 2024 value. This webpage shows that there are no significantly increasing trends in the frequency of hurricanes or major hurricanes or hurricane days. Larry Hamlin wrote in this article “These outcomes clearly dispute and invalidate decades long flawed and contrived climate alarmists claims that these global storms are growing stronger and more intense because of man-made climate change.”
The Energy Storage Fiasco -- How Soon Will It Be Abandoned?
Several articles were published showing that the amount of battery energy storage needed to make wind and solar work as the main power sources for an electricity grid is so large, and the costs so unaffordable, that battery storage was totally infeasible, see here, here and here. Francis Menton wrote “the amount of energy storage needed to enable a predominantly wind/solar grid to get through a year without hitting a blackout was in the range of 500 to 1000 hours of average electricity usage.” The low end to that range requires the wind and solar capacity to be far larger than that required to generate the total annual electricity demand. Lithium-ion batteries have an unfortunate downside that they occasionally catch fire spontaneously. Grid-scale batteries must store thousands of megawatt-hours of electricity, compared to maybe 100 kWh for an EV. New York State requires 8,500 to 17,000 GWh of battery storage capacity to prevent blackout of a wind/solar/battery electrical system but only 1.2 GWh of that has been built. Menton wrote “And yet, between May and July 2023, New York had had three large fires at the grid battery storage facilities.” California requires 15,000 GWh to 30,000 GWh of batteries for their planned wind/solar/battery system. They have 54 GWh of storage built so far. From September 2022 to January 2025 there were three large fires at battery storage facilities. The fire at Moss Landing facility started at January 16. The fire required a mandatory evacuation of 7600 acres, or about 12 square miles involving 1200 to 1500 residents. New York City plans to soon start construction of a large battery facility near Midtown Manhattan. A 12 square mile evacuation zone around this facility would require the evacuation of hundreds of thousands of people. Lithium battery fires release toxic gases that cause severe respiratory distress, skin burns, eye irritation, and even death.
AMOC study: Critical Ocean Current has not Declined in the last 60 Years
A new study by scientist from the Woods Hole Oceanographic Institution found that the Atlantic Meridional Overturning Circulation (AMOC) has not declined in 60 years, indicating that it currently is more stable than expected. The AMOC regulates the Earth’s climate by moving water though the Atlantic Ocean powered by winds and water density. Previous studies that reported a declining AMOC relied on sea surface temperatures (SST) but the scientists of the new study found that SST doesn’t work as well as initially thought. Using 24 climate models, the scientist found that temperature data did not accurately reconstruct the AMOC. They found that when the AMOC is stronger, more heat is released from the ocean to the atmosphere over the North Atlantic. The best data for surface heat fluxes over the North Atlantic come from reanalysis products. The paper states that air-sea heat flux anomalies in the North Atlantic are tightly linked to the AMOC and that “the decadal averaged AMOC has not weakened from 1963 to 2017.” This strongly suggests that a weakening of the AMOC is unlikely to occur in the foreseeable future.
CliSci # 422 2025-01-06
CLOUD Experiment Resolves Puzzle of New Tropospheric Aerosol Particles
Isoprene emitted by tropical forests may provide a globally important source of aerosol particles that influence clouds, according to a new study by the CLOUD collaboration at CERN according to a new study. CERN issued a press release about the study. The press release said “Isoprene emitted by tropical forests may provide a globally important source of aerosol particles that influence clouds, according to a new study by the CLOUD collaboration at CERN. Aerosols are microscopic particles suspended in the atmosphere. They play an important role in Earth’s climate system because they seed clouds and influence their reflectivity and coverage. CLOUD comprises a 26 m3 ultra-clean chamber filled with atmospheric gases and a suite of advanced instruments that continuously analyse its contents. A beam of charged pions are fired from CERN’s Proton Synchrotron to mimic the influence of galactic cosmic rays. CLOUD spokesperson Jasper Kirkby said “High concentrations of aerosol particles have been observed high over the Amazon rainforest for the past twenty years, but their source has remained a puzzle until now. Our latest study shows that the source is isoprene emitted by the rainforest and lofted in deep convective clouds to high altitudes, where it is oxidised to form highly condensable vapours. Isoprene represents a vast source of biogenic particles in both the present-day and pre-industrial atmospheres that is currently missing in atmospheric chemistry and climate models.” The CLOUD findings are consistent with aircraft observations over the Amazon, as reported in an accompanying paper. Together, the two papers provide a compelling picture of the importance of isoprene-driven aerosol formation and its relevance for the atmosphere. Kirkby said “This new source of biogenic particles in the upper troposphere may impact estimates of Earth’s climate sensitivity, since it implies that more aerosol particles were produced in the pristine pre-industrial atmosphere than previously thought”. Joanne Nova discusses the results and implications.
Antarctic Peninsula Warming
My article titled “Sustained Greening of the Antarctic Peninsula” in CliSci # 421 included the sentence “The Antarctic Peninsula is one of the fastest warming places on Earth.” It was based on the first paragraph in the referenced paper. One of the FoS Directors, Ian Cameron, questioned this statement. He noted that the Antarctic Land temperature trend, labeled as “SoPol-Land”, in the UAH lower troposphere temperature record was only 0.09 °C/decade, which is far less than any other land region. Using climate explorer, I plotted the annual land temperatures of the Antarctica Peninsula (AP) from the Climate Research Unit (CRU5) surface station data and the University of Alabama in Huntsville (UAU6) lower troposphere satellite land-only data for the years 1980 to 2023.

The graph shows that the CRU station temperature trend is 0.352 °C/decade. The UAH6 satellite temperature trend is negative at -0.052 °C/decade. There are numerous research stations on the AP and its population has increased over the years. The population of the Antarctic Peninsula varies seasonally, with around 1,000 to 1,500 people during the summer research peak and 200 to 300 people during the winter. I suspect that the primary reason for the large difference in temperature trends is due to the urban heat island effect.
Global Greening by CO2 Fertilization and Climate Change
A new paper uses robust statistical method to determine greening and browning trends from remote sensing data. This research used the Advanced Very High-Resolution Radiometer (AVHRR) Normalized Difference Vegetation Index (NDVI) data from NOAA's polar-orbiting satellites. The scientists report that over the 42 years (1982 to 2023), the Earth experienced statistically significant vegetation trends over 38% of the land surface. Of this land area, 76% was greening while 24% were browning. Considering areas with NDVI values above 0.15, greening accounted for 85% of the significant trends with browning accounting for 15%. NDVI values from 0.1 to 0.5 indicate sparse to moderate vegetation, and values about 0.6 indicate dense green vegetation. The paper says “Although vegetation greening has been reported on all continents, it is particularly pronounced in Eurasia, including regions of Europe and China.” The authors claim that their significant trends methodology eliminates spurious trends and providing a more accurate assessment than previous assessments. The abstract says “These findings strongly validate the ongoing global greening of vegetation.” Kenneth Richards provides a summary of the paper. He wrote “In other words, greening trends dominate over browning trends at a ratio of about 4:1, or 80% to 20%.”
Large Antarctic Calving Events: Nothing Unusual
Many media outlets posted stories in 2017 about iceberg A-68 calving off of Antarctica’s Larsen C ice Shelf. CNN said we should be freaking out about it because of climate change. A new study says large calving events are nothing abnormal, nor should we worry about it. The study’s abstract says that the authors used “47 years of iceberg size from satellite observations. Our analysis reveals no upward trend in the surface area of the largest annual iceberg over this time frame. This finding suggests that extreme calving events such as the recent 2017 Larsen C iceberg, A-68, are statistically unexceptional and that extreme calving events are not necessarily a consequence of climate change.” A key point of the study is “There is no upward trend in the surface area of Antarctica's annual maximum iceberg between 1976 and 2023.” The analysis shows that extremely large calving events are likely typical of a healthy ice sheet system. There exists a quasi-stable cycle of calving front advance and retreat. The lack of an upward trend in annual maximum iceberg area could be attributed to an overall increase in the number of smaller calving events, which may inhibit the development of extremely large calving events.
Anthony Watts wrote “In other words, the media made a big ado about nothing. Will this new study by MacKie et al. disproving the climate alarm noise in 2017 get a lot of press? Probably not. It doesn’t fit the sensationalistic narrative of pending climate doom promoted by the media. They’d just as soon sweep this inconvenient truth under the rug than admit they weren’t just wrong, but wildly so.”
2024 Sets New Record for Warmest Year in Satellite Era (Since 1979)
Dr. Roy Spencer published a graph showing the global annual average lower troposphere temperatures ranked from warmest to coolest. According to the UAH6.1 satellite data, the 2024 temperature was 0.34 °C higher than in 2023. Spencer wrote “As seen in the following ranking of the years from warmest to coolest, 2024 was by far the warmest in the 46-year satellite record averaging 0.77 deg. C above the 30-year mean, while the 2nd warmest year (2023) was +0.43 deg. C above the 30-year mean. [Note: These yearly average anomalies weight the individual monthly anomalies by the number of days in each month.]” The 2023 temperature was 0.040 °C higher than the 3rd ranked year of 2016.
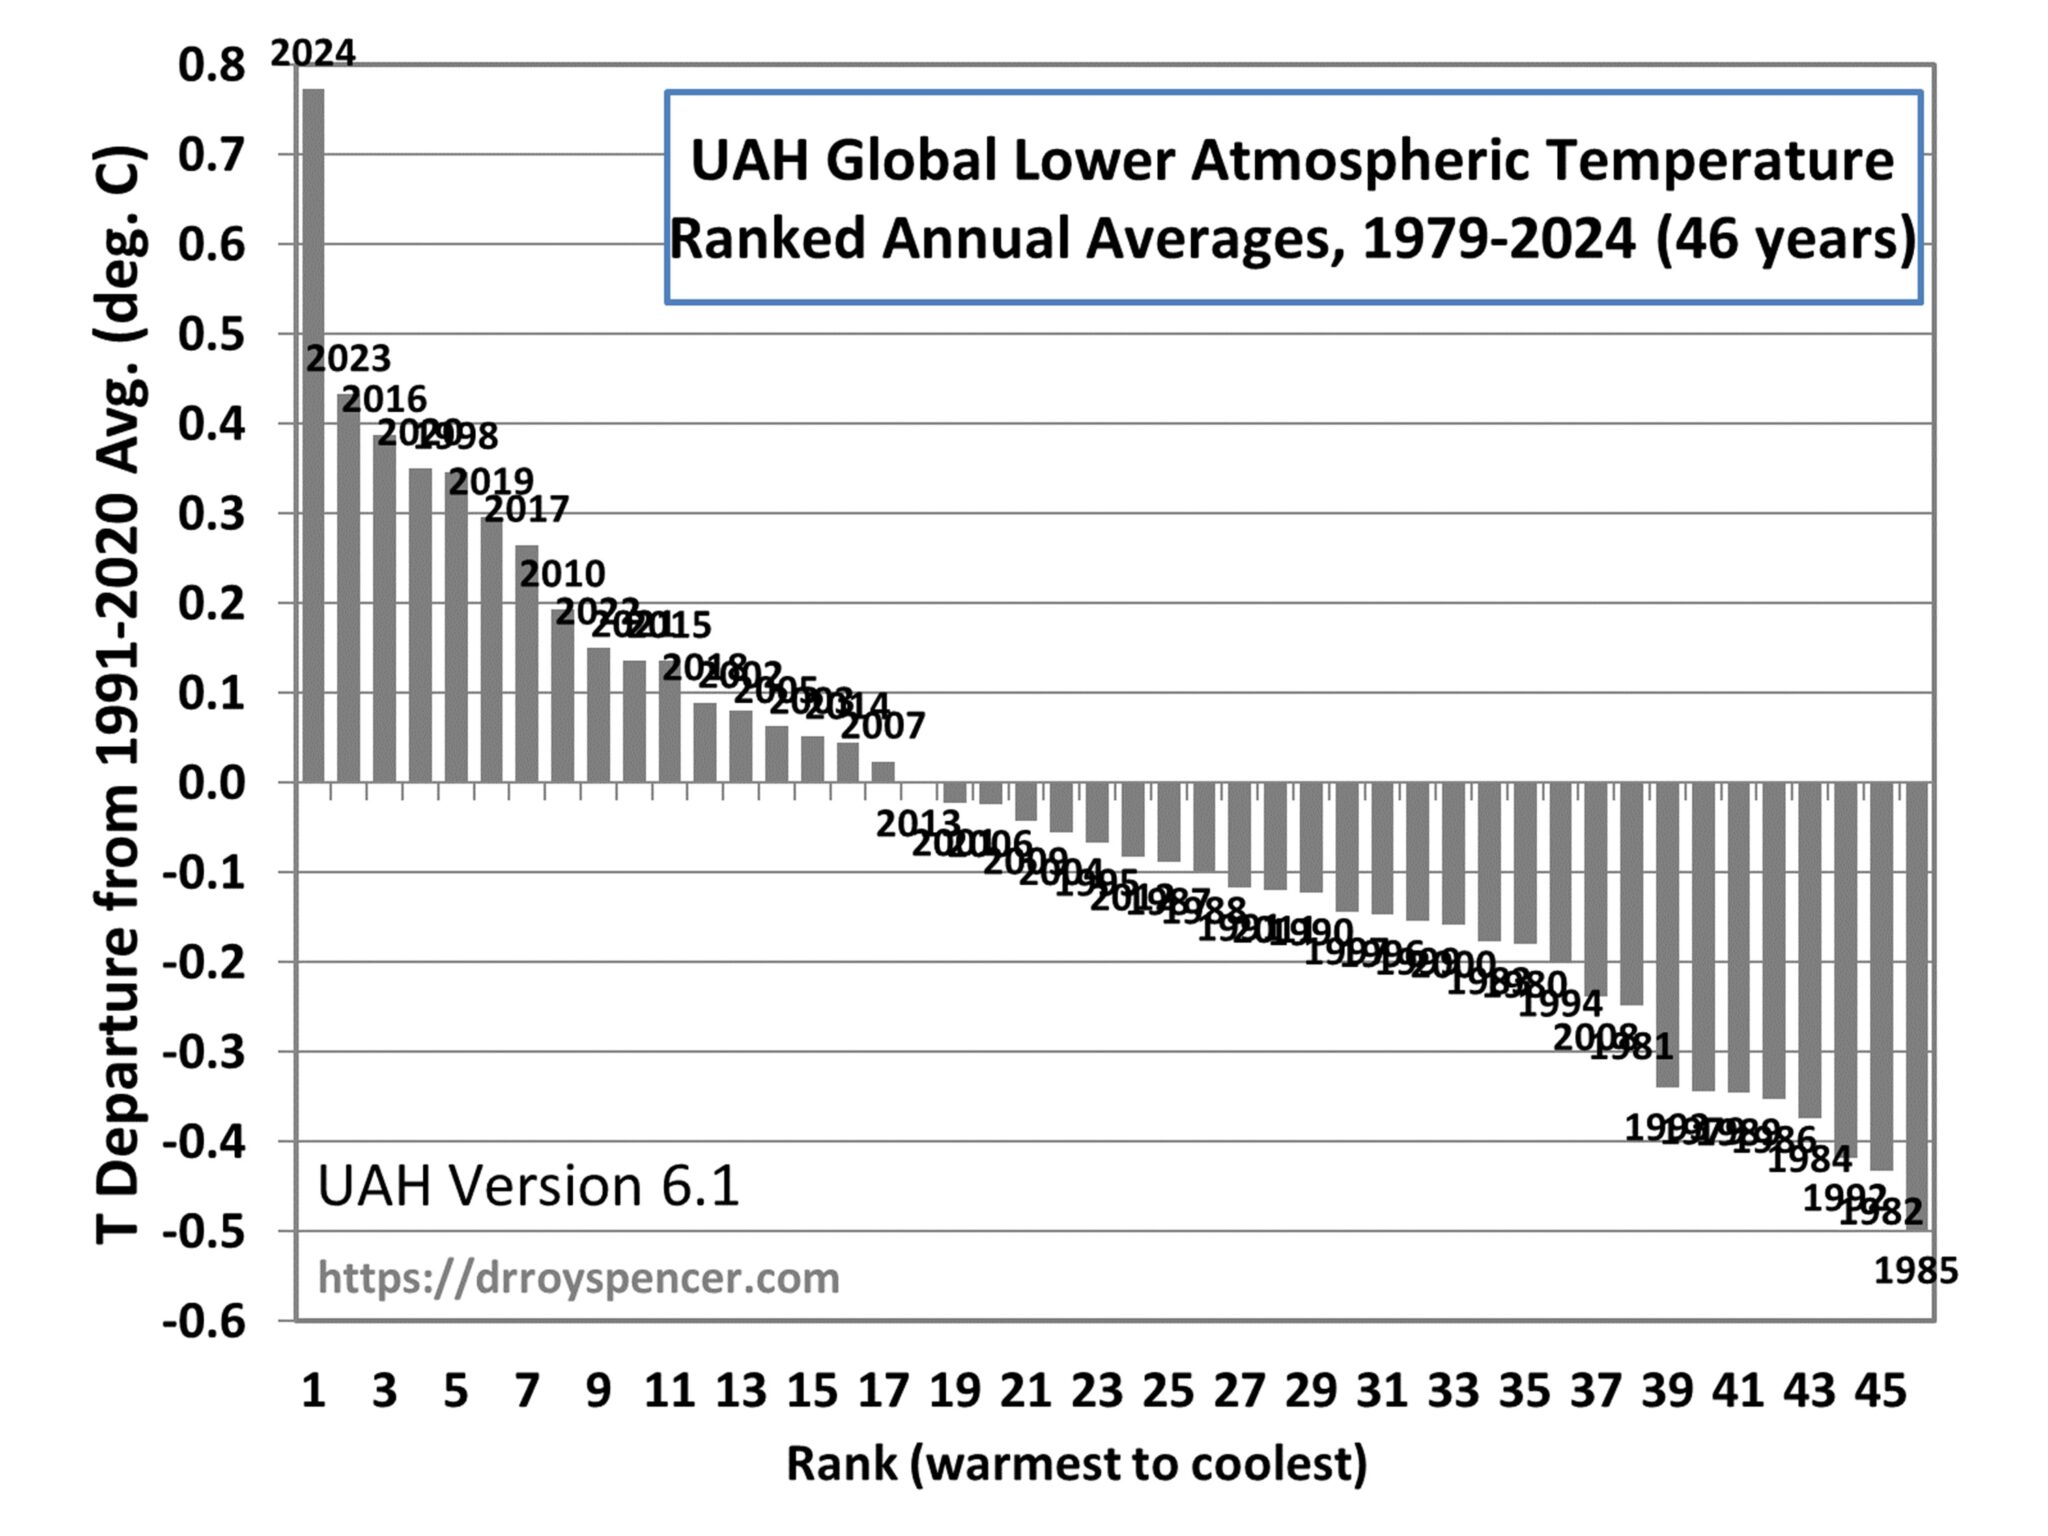
Why was 2024 so warm? It can’t be due to increasing greenhouse gas concentrations because they cause only a gradual upward creep of global temperatures. According to NOAA, the total GHG forcing has increased on average over the last four years by 0.040 W/m2 per year, which should cause a global warming of 0.016 °C/yr assuming a climate sensitivity of 2.0 °C per double CO2. ENSO is the most common cause of large yearly variability, but this graph of the multi-variate ENSO index shows that 2024 started with a small El Niño and ended with a small La Niña, so ENSO had little effect on the 2024 average temperature. The large temperature rise in 2024 was very likely due to the eruption of Hunga Tonga-Hunga Ha'apai (HTHH) volcano as shown by this paper. The paper “reveals that surface temperatures across large regions of the world increase by over 1.5 °C for several years.”
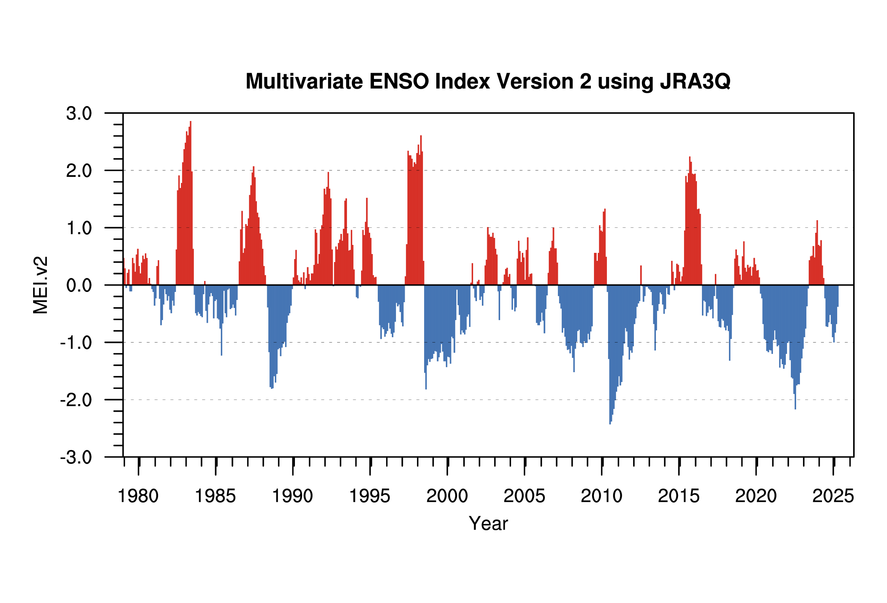