
By: Ken Gregory, BASc.
CliSci # 453 2026-07-19
Trends and Patterns in U.S. Daily Total and Extreme Precipitation Since 1983
A new paper, still under review, by John Christy and Ross McKitrick presents a continuous, complete, quality-controlled record of daily precipitation for 377 locations across the continental US. The authors applied trend analyses over multiple time scales on eight precipitation metrics covering total, extreme and clustering phenomena. They we find positive trends tend to be in eastern regions, although the west-east contrast attenuates after 1980. Upward trends in annual total precipitation are found in the Mid-West, Northeast and Gulf South but they do not persist in the post-1980 subsample. Annual maximum precipitation has trended up in the Southeast and Atlantic South region post-1980 while summertime precipitation in the Intermountain region has trended down since 1958. Annual maxima are sensitive to El Niño events but global warming plays an insignificant role. The extent of regional and temporal heterogeneity argues against trying to make continental-scale generalizations regarding changes in average or extreme precipitation.
Europe's Weather Losses Have No Trend After Accounting for Economic Growth
Roger Pielke Jr. presented a new normalization analysis of Europe’s weather and climate catastrophe losses for 1990 to 2024. The analysis includes 38 European countries, but not the UK. The economic loss data is from the European Environment Agency. After accounting for economic growth, the normalized cost of weather and climate extremes in Europe has not increased over 1990–2024. The overall trend is flat. Economic losses from weather-related events across the 38 countries in constant 2024 Euros have increased at +0.75 billion Euros/yr. This fact has resulted in the European Commissioner for Climate and Net Zero to falsely claim that climate change is bringing ever-larger economic damage to our societies. Over these 35 years, the combined economy of the 38 countries has more than doubled in real (inflation-adjusted) terms. That growth of wealth created more stuff exposed to extreme storm events. A normalization corrects for changing exposure and vulnerability. Each year losses are normalized by the annual GDP. The 1990 and 1999 storm seasons exceed all annual losses since 1999. Losses in 1999 were 0.30% of GDP. The highest GDP adjusted losses over the last three decades was 0.25% of GDP in 2021. Since then, losses have declined to 0.13% of GDP in 2024. Normalized losses over the 1990-2024 period were concentrated in the largest economies, with Germany accounting for 19.5% of the total losses. More interesting is that losses as a share of each countries GDP vary greatly, from a high of 1.02% in Slovenia to a low of 0.01% in Kosovo. Germany, which has the highest normalized losses over the period, has losses of 0.13% of its GDP, which is near the all-country average of 0.12% of GDP. The direct economic losses from weather and climate events have scaled proportionately with the region’s growing economy. Pielke concludes his post “Regardless how climate varies and changes, future losses from extremes will be largely a function of where and how we build, and policies put into place in recognition of the ever-present risks of extreme events.”
NASA’s Models Wildly Underestimate the Capacity of Clouds to Alter Solar Radiation
Clouds are the largest moderator of Earth’s radiation budget, and their absorption of solar radiation directly influences our understanding of climate change. Cloud absorption anomaly refers to the phenomenon that observed cloud-absorbing solar radiation from satellite and surface measurements, often notably exceeds the theoretical calculation by models. This systematic discrepancy (or bias) may heavily hinder our modeling or projection on climate change through models according to this new study. There have been improvements in both observations and radiative models over the last two decades. The new study investigates the current discrepancies using three model-derived reanalysis and recent observations from satellites and the surface. The anomaly involves only the solar shortwave radiation, not the longwave radiation that determines the greenhouse effect. All three models underestimate mean cloud absorption compared to observations: NCEP CFSv2 simulates about half of the observed value, ECMWF ERA5 about one-third, and NASA MERRA2 less than one-quarter. NECP CFSv2, ECMWF ERA5 and NASA MERRA2 under estimate globally-mean cloud absorption by approximately 10.54, 16.79 and 18.80 W/m2, respectively. See also this article about the study by Kenneth Richards.
Bjorn Lomborg: The WHO’s Climate Prescription Is Bad Medicine
“Heat deaths are up, though mainly because old people are a much larger share of the population, while deaths from the cold are way down.” That is subtitle of an article by Bjorn Lomborg in the Financial Post. Lomborg’s newsletter says “A WHO commission wants to declare climate change a “global health emergency.” Their big evidence? Rising heat deaths in Europe. But once you adjust for an aging society, the “crisis” essentially disappears. Even more dishonestly, the report conceals that cold deaths have declined by approximately 250 times as much as heat deaths have risen.” The Financial post article says “A high-profile WHO commission made up of politicians and green advocates last month urged the organization to declare climate change a “public health emergency of international concern.” European heat death risk has risen 82% since 1990. But the risk rises sharply with age and Europe has aged dramatically. Since 1990, the share of its population over 70 has increased by 78%, so aging alone explains virtually the entire increase in heat deaths. Both the study and the commission simply ignore this. The Global Burden of Disease, the world’s leading mortality database, finds that Europe’s standardized heat-death risk has changed only marginally since 1990. At current population, the increase amounts to fewer than 850 additional heat deaths. The WHO commission’s unstandardized figures exaggerate the problem more than 50-fold. Age-standardized data shows that cold death rates in Europe have declined by nearly 50% since 1990. At today’s population levels, that translates to roughly 210,000 fewer cold deaths each year. A similar article was published in the Wall Street Journal.
Greenland Summer Melt Is a Month Late
Much of Europe is enjoying (or sweltering in) high temperatures due to a blocking high, while Greenland gets a low-pressure depression with cool and wet weather. This article by Paul Homewood presents graphs showing Greenland’s daily and cumulative surface mass balance. Homewood wrote July 8th “The summer melt has not even begun yet and is already a month overdue.”
Japan Chooses Reliable Energy Over Climate Nonsense
This article by Vijay Jayaraj describes how Japan switched policies from pledging decarbonization to a reliable, energy-first policy, ie, fossil fuels. Japan planned for years to phase out coal. The government pledged to cut greenhouse gas emissions by 60% by 2035. Japan imports 94% of its crude oil from the Middle East. With the interruption of transit through the Strait of Hormuz, Japan introduces gasoline subsidies and released 80 million barrels of oil stockpiles, equivalent to about 45 days of domestic demand. Imports are already increasing from the United States, Canada, Mexico and many other countries. Japan Petroleum Exploration plans to quadruple its oil and gas output over the next decade—up to 180,000 barrels of oil equivalent per day by 2035—backed by US$7.3 billion in exploration and production spending. Japan’s vast petrochemical industry converts crude into synthetic fibers, fertilizers, resins, paints, and electronic components. Japan, like its neighbor South Korea, is reopening coal-fired power plants once condemned as relics of a dirtier era. Energy officials cited “extraordinary supply uncertainty” as justification for using the same fuel they had promised to eliminate. Expanded coal usage, combined with restarted nuclear plants, would offset about 40% of the LNG imports Japan previously received through the Strait of Hormuz.
CliSci # 452 2026-07-02
Europe’s Heat Deaths Are a Policy Failure, not a Climate Failure
Newsweek claims in a recent story that “hundreds die in record-breaking Europe heat wave” suggesting that greenhouse gas emissions are making heat domes more dangerous. Excessive heat can be deadly for the elderly. This article by Anthony Watts asks why heat waves in Europe causes death spikes, but hotter temperatures in southern U.S. states every summer don’t cause comparable spikes in heat-related deaths. The difference isn’t weather or temperatures. It is policies restricting or disincentivizing air conditioning. More than 90% of homes in the U.S. have air conditioning. In the southern states, air conditioning is in almost all homes, hospitals, nursing homes, schools, offices and shopping centers. In contrast, only about 20% of homes in Europe have air conditioning and less than 5% in the United Kingdom. The article says “British building regulations and planning guidance have long emphasized ‘passive cooling’ while treating air conditioning as something to be avoided whenever possible. Many homes, schools, offices, and even some hospitals were built or renovated without air conditioning because policymakers viewed it as environmentally undesirable.” The current event is attributed to a persistent high-pressure system known as a heat dome. Europe always had heat-waves. There is no observational evidence of a long-term trend of timing, location, or severity of heat domes.
Watts wrote “The continent has spent years pursuing energy policies that increased electricity prices while simultaneously discouraging one of the greatest public health technologies ever invented. Air conditioning has saved millions of lives worldwide. It dramatically reduces heat stress, prevents dehydration, and protects the elderly during extreme weather.”
The temperature rise in Europe over land [35 - 65°N, -10 – 30°E] from 1980 to 2023 is 0.412 °C/decade (CRUTEM5), of which half is caused by the urban heat island effect. The corresponding air temperature rise is 0.175 °C/decade (LT UHA6.0), which is only 42% of the land surface station measurements!
Pumped Storage Power Station to be Built on Loch Ness
Loch Ness is a deep, large freshwater lake in the Scottish Highlands, stretching 37 km southwest of Inverness. Famous globally for the legendary "Loch Ness Monster" (Nessie), it holds more water than all lakes in England and Wales combined. The U.K. energy regulator approved (paywalled) a scheme to use surplus electricity from wind farms to pump water from Loch Ness into others further uphill, mainly Loch Kemp. Water would then be released and naturally run downhill, spinning turbines and generating power at times of need in the process. This would provide backup power at times when wind or solar generation falters. A new dam would be built at Loch Kemp to expand its capacity and underground pipes would connect it to Loch Ness. The pumped hydro storage scheme would cause the lake levels to change by up to one meter a day. This article says “Brian Shaw, the chief executive of the Ness District Salmon Fishery Board, said: ‘It’s absolutely crazy to have a world-renowned, iconic lake like Loch Ness subject to these harmful schemes. It will turn it into a tidal lake, damaging the shoreline ecology with the plumes of turbulent water from the pipes, damaging the water quality.’” Paul Homewood wrote “This Lock Kemp scheme will store about 5 GWh, which will only be enough to keep the grid running for about 5 minutes.” This will be of little use during common two-week Dunkelflautes (period of little to no wind and sunshine). The cost of the project is about £1 billion, or US$1.33 billion. Therefore, the pumped hydro storage cost is 270 US$/kWh. A utility scale battery storage system in Europe costs about 250 US$/kWh.
Hurricane Lies
Robert Vislocky, Ph.D., wrote this article which says that news media articles and a technical journal paper incorrectly conflate a rise in the “Ratio” of the number of major to total tropical cyclones (TC) with a rise in total TC intensity. He examines a 2020 PNAS paper by Kossin et al. that reported the Ratio increased over the period 1980 to 2017 by a statistically significant amount. However, Vislocky says that the authors later conflate that to mean that there is an increasing trend in TC intensity. He presents a graph of the Ratio of major to total TC from 1980 to 2025 which shows an increasing linear trend, from 0.45 in 1980 to 0.57 in 2025, using this data. Major TC are those of Saffir−Simpson categories 3 to 5. The New York Times published an article saying “Climate Change is Making Hurricanes Stronger” citing the PNAS paper, which said no such thing. Vislocky wrote “The proportion of major TCs to total TCs is NOT a valid measure of absolute hurricane intensity. … As one example, 2018 had 43% more TCs and 43% more major TCs than 2024. It also had a 75% higher global accumulated cyclone energy (ACE) value. Yet according to the flawed Ratio statistic, both years were identical!!” The global annual ACE shows an insignificant declining trend. Although the PSAS paper found a significant Ratio trend from 1980 to 2017, there is no Ratio trend from 1994 to 2025.
Chile’s Relative Sea Level Was 3.2 Meters Higher Than Today During the Mid-Holocene
Validating future sea-level rise models requires past sea-level data. However, on tectonically active coastlines—which comprise 30% of global coasts—separating vertical land motion from climate-driven sea-level changes is difficult because both operate at similar amplitudes.
To address this, researchers developed a new framework using high-resolution LiDAR and numerical modeling to analyze Holocene marine terraces along 500 km of the Chilean coast. They discovered that Holocene terrace elevations correlate linearly with Late Pleistocene ones, proving steady-state tectonic uplift over the past 125,000 years. This allowed researchers to isolate the tectonic component and reveal that the mid-Holocene sea-level reached 3.2 ± 0.2 m above modern levels from about 7000 to 5500 years ago. Accounting for these long-term vertical land motion rates can significantly improve future relative sea-level projections. Higher sea-level during the mid-Holocene proves that global temperatures were significantly higher then than now. Temperatures varied though the Holocene indicating that natural climate variability is large.
CliSci # 451 2026-06-13
A Question on Precipitation Intensity
A FoSS member who registered for the FoSS AGM of June 10 asked this question; “If the alarmists say that precipitation events are getting more intense because of overall warming temperatures (because the warmer it is the more moisture is retained), what's the climate-realist response to this?” My response is;
Cumulonimbus clouds are vertically developed clouds that grow toweringly high into the atmosphere. They produce intense, heavy downpours, often accompanied by thunder and lightning. They are associated with cold fronts, where warm, moist air is forced to rise rapidly. A warming world warms the Arctic region more that the tropics, which reduces the temperature gradient that powers these storms. This makes these storms less likely and weaker. This effect may reduce the precipitation intensity.
In general, warming is expected to increase both evaporation and precipitation, but the effect is small. Here is a graph of precipitation over land 60 N to 60 S showing annual data from CRU and NCDC. The trends since 1950 are insignificantly negative and there is a lot of annual variation. There is no indication of increasing precipitation. Hurricanes and tropical storms are mostly in the tropics. This graph of precipitation over land from 25 N to 25 S shows a small decline from 1959 to 2023.
Just before precipitation begins, a mid-latitude cumulonimbus cloud typically reaches a peak Liquid Water Content (LWC) ranging from 1.0 to 3.0 g/m3. By the time a mid-latitude cumulonimbus cloud finishes raining, its LWC typically drops to 0.1 to 0.3 g/m3, representing a massive 90% decrease from its pre-precipitation peak. If warming is expected to make clouds hold more water, you might expect the clouds to stop raining at a higher LWC, thereby reducing precipitation, but cloud models don’t show this. The start-of-raining LWC is expected to increase with warming, increasing the amount to rain, but the precipitation data so far doesn't show that.
This graph shows the high precipitation events with daily rainfall greater or equal to 40 mm/day in the nine townships (324 sq. miles) encompassing the city of Calgary. It shows a best fit decline of daily high precipitation events from 1980 to July 2025 from 55 to 48 mm/day. So, at least in the Calgary area, severe precipitation events are declining.
Ocean "Acidification" -- Another Fake Scare That Won't Go Away
The ocean “acidification” scare is based on the idea that CO2 emission leads to more CO2 dissolved in the oceans which lowers the pH of sea water. A problem for the advocates of this scare is that the oceans are alkaline, rather than acidic, and the pH changes are very tiny. Francis Menton wrote “And the pH change, even in worst-case scenarios, is not nearly enough to bring it down to the level of neutrality, let alone acidity.” Two researcher published 22 papers that claims lower ocean pH causes tropical fish to experience “profound behavioral and sensory impairments”. These studies were shown by a paper in 2020 that the previous results are not reproducible. The end-of-century ocean pH levels have negligible effects on behaviours of coral reef fish.
Menton discusses a new paper by Willian van Wijngaarden et al that shows “that it is preposterous to believe that the slight decline in ocean pH caused by increased atmospheric CO2 can cause any significant problem for ocean life.” The paper’s abstract says “Fundamental inorganic chemistry shows that increasing concentrations of atmospheric CO2 will have no harmful effect on organisms that live in the natural waters of the Earth, and may well benefit them. Alkalinity and dissolved CO2 give high buffering capacity to most natural waters and minimize the change of pH from external influences. For example, doubling the atmospheric concentration of CO2 from 430 ppm to 860 ppm would reduce the pH of representative sea water at a temperature of 25 °C from pH = 8.18 to pH = 7.93. This change is comparable to diurnal pH changes in biologically productive surface waters, due to photosynthetic fixation of dissolved inorganic carbon during the day and respiration at night. The change is also less than the variations of pH with latitude, longitude and depth in the oceans.” Neutral pH is 7, alkaline is above 7. A doubling of CO2 would cause the pH value to move only 21% toward the neutral level of ph 7, still very far from being acidic. If CO2 increases linearly, the doubling from 2026 would occur in the year 2200, or in 174 years!
A Change in Measurement Method Creates Unnatural Heat Spikes
This article shows that record temperatures recorded at a surface temperature station called “Kew Garden” in England has been recording unnatural heat spike. Kew played a central role in creating warming alarm during the first heatwave of the British summer. Chris Morrison wrote “Last year, the Met Office claimed an all-time UK high May 1st temperature at Kew of 29.3 °C. Analysis by citizen scientist Dr Eric Huxter showed the temperature was almost 2 °C above that recorded in the hour before – well above what might be expected from such temperature rises seen during the day, with movements commonly around the plus or minus 0.2 °C to 0.4 °C mark.” May 25th, when the temperature at the Kew site rose to 34.8 °C – some 1.3 °C above the previous hour.
The main culprit in producing these heat spikes is the switch from liquid-in-bulb thermometers to Platinum Resistance Thermometers (PRT) automatic electronic measuring devices during the last 30 years. These provide a more accurate reading every minute, but it is plain that they are picking up every passing heat spike – often unnatural – that were missed by slower-moving liquid in a glass bulb. One-minute heat spikes at the 24-hour maximum are used to calculate daily average temperatures, which eventually find their way into national and international databases. Dr Huxter has provided dramatic proof that PRT electronic devices located at an open-field site cannot produce such heat spikes as found at stations like Kew in urban areas. There are plenty of nearby heat sources to cause spikes of temperatures. Dr Huxter wrote “The observed changes in temperature over the past 30 years therefore owe more to flaws in measurement… rather than any wider anthropogenic effect. The uncritical adoption of the PRT technology, which conveniently reinforced what the modellers believed, now drives the Net Zero Cult.”
Bonfires of the Batteries
This article by Richard Ellenbogen raises serious safety concerns about the deployment of Battery Energy Storage Systems (BESS) in densely populated areas. A real-world New York case underscores how quickly a “managed” battery incident can turn into a literal bonfire of the batteries. The author found that exposure to nickel, manganese, and cobalt from Li-Ion battery fire runoff in porous soil and shallow aquifers heightens risks due to rapid leaching into groundwater. Runoff from battery fires can contaminate drinking water and crops, leading to bioaccumulation in the food chain. This is in addition to the more immediate, very serious threat to people in nearby neighborhoods from heat and toxic gases in the event of a fire. The Suffolk County Water Authority sued the owners of a BESS Facility in East Hampton, NY for the contamination of two water wells as a result of runoff from a BESS Fire on May 31, 2023. The suit alleges that 2.2 million gallons of water were used to suppress the fire. The records of the fire are incomplete. Ellenbogen wrote “For an event that has potentially contaminated 7% of the water supply of Suffolk County to have no discernible government record shows a failure of public policy, especially since these systems are being promoted by NY State to support their poorly planned energy policy.”
Global Rice Production Has Doubled over 50 Years Despite Climate Change
A new study found that global rice production nearly doubled between the 1960s and the 2010s, despite the negative impacts of climate change. The study found that expanded irrigation and increased nutrient inputs played a central role in sustaining rice production. The study also demonstrates that climate change is the only factor in the analysis that reduced rice production, lowering global production by an estimated 7% between 2006 and 2015 because of warming temperatures, heat stress and water shortages. In contrast, rising atmospheric CO2 was the primary environmental factor contributing to increased rice production by enhancing photosynthesis and improving water-use efficiency.
CliSci # 450 2026-05-27
NOAA Predicts a Below-normal 2026 Atlantic Hurricane Season
The US National Ocean and Atmospheric Administration (NOAA) issued their 2026 hurricane season forecast on May 21, 2006.
Forecasters with NOAA’s National Weather Service are predicting a below-normal hurricane season for the Atlantic basin this year. NOAA’s outlook for the 2026 Atlantic hurricane season, which runs June 1 to November 30, predicts a 35% chance of a near-normal season, a 10% chance of an above-normal season, and a 55% chance of a below-normal season. The agency is forecasting a total of 8-14 named storms (winds of 39 mph or higher). Of those, 3-6 are forecast to become hurricanes (winds of 74 mph or higher), including 1-3 major hurricanes (category 3, 4 or 5 with winds of 111 mph or higher). NOAA has a 70% confidence in these ranges. An average season has 14 named storms with seven hurricanes, including three major hurricanes.
How Well Does NOAA’s Hurricane Outlook Actually Perform?
NOAA publishes a forecast of the upcoming hurricane season each year in May. A review of 26 years of NOAA’s May seasonal outlook versus what actually happens shows that the US agency hits its stated forecast range of about 69% of the time on named Atlantic storms and hurricanes, just shy of its self-declared 70% confidence target. This article says that NOAA “has a notable tendency to miss badly in the most extreme seasons, and a historical bias toward under-forecasting activity when the Atlantic is running hot.” Over 26 years, both the named storm and hurricane forecasts were accurate 69% of the time (18 out of 26 years). However, there were big misses. The table below shows four years when the forecasts were badly off. In 2005 and 2020 the forecasts were too low. In 2006 and 2013 the hurricane forecasts were much too high. The article shows the results for all 26 years.
| Named Storms | Hurricanes | |||
|
Forecast |
Actual |
Forecast |
Actual |
|
| 2005 | 12-15 | 28 | 6-8 | 15 |
| 2006 | 13-16 | 10 | 8-10 | 5 |
| 2013 | 13-20 | 14 | 6-10 | 2 |
| 2020 | 13-19 | 30 | 6-10 | 13 |
Despite some bad forecast year, the forecasts mostly have the season character correct. The article says “Even when the exact numbers miss, NOAA generally gets the character of the season right, calling above-normal, near-normal, or below-normal correctly most of the time. That directional skill has improved over the 25-year period.”
RCP8.5 is Officially Dead
The international committee responsible for the official scenarios that feed into climate modeling has just published the next generation of climate scenarios. Dr. Roger Pieke Jr. wrote on his substack “Big news: The new framework has eliminated the most extreme scenarios that have dominated climate research over much of the past several decades — specifically, RCP8.5, SSP5-8.5, and SSP3-7.0. This is an absolutely huge development in climate science which will have lasting impacts across research and policy.” The scenarios that have dominated climate research, assessment, and policy describe impossible futures. Pielke wrote “Tens of thousands of research papers have been — and continue to be — published using these scenarios, a similar number of media headlines have amplified their findings, and governments and international organization have built these implausible scenarios into policy and regulation.”
The new scenarios are named CMIP7 followed by High, Medium and Low. The name doesn’t include a 2100 radiative target like 8.5. The new High reaches 71 Gt CO₂/yr in 2100 — far below SSP5-8.5 at 128 Gt in 2100. The new High also sits below SSP3-7.0 by about 9% in terms of cumulative emissions to 2100. The 2100 effective radiative forcing (ERF) of scenario CMIP7-high is 6.7 W/m2, which is lower than the 7.0 W/m2 of scenario SSP3-7.0. The 2100 ERF of CMIP7-medium and -low are 5.3 and 3.1 W/m2, respectively. The authors of the CMIP7-high scenario wrote about that scenario “Clearly, this scenario is not a “business-as-usual” scenario nor the no-policy reference scenario for the other scenarios. The scenario is intended to explore the upper end of GHG emissions resulting from deep political, technological, and structural deviation from current trends.”
Climate Pseudoscience Debunked: Livestock Methane Fears are Baseless
An article by Gregory Wrightstone of the CO2 Coalition discusses the conclusions of new paper titled “Livestock, Methane and Climate” that shows reducing methane emissions from livestock would have an insignificant effect on global temperatures. Many countries are pursuing policies to reduce livestock emissions which would burden consumers with higher grocery bills. The article says “Even if all 1.6 billion of Earth’s cattle were killed, the amount of warming averted would be an immeasurably small 0.04 degrees Celsius, according to the paper. The temperature reduction from killing all 1.3 billion sheep would be 10 times smaller. Even more absurdly, New Zealand’s national goal of reducing cattle and sheep emissions would affect temperature by no more than 0.000008 degrees Celsius. Even these tiny amounts would be made smaller by the emissions of wild ruminants, such as deer and termites, replacing domesticated animals as agricultural lands reverted to forests and grasslands. No rational person would invest a single dollar to achieve such insignificant temperature reductions.”
The digestion systems of livestock convert certain carbohydrates into useable energy that humans cannot digest. These animals convert low-value vegetation into highly nutritious meats and milk. Modest warming since the 19th century closing of the Little Ice Age has had beneficial effects on ecosystems and crop production. Whitestone wrote “The case for attacking livestock methane is nonexistent, and the cost is enormous. Policymakers must start paying attention to real science and common sense.”
The State of the Climate 2025 Global and Arctic Based on Real Observations
The United Nations Secretary General, António Guterres on July 27, 2023, declared: The era of global boiling has arrived. Dr. Ole Humlum published this state of the climate report and found no sign of a coming climate crisis. The abstract of his paper says;
“Real observations show a slight decrease of global temperature in 2025 compared with the previous ten years. Some stations in the Arctic show warming, but most are fairly stable. The Arctic Ocean is cooling to considerable depth, while the tropical and Antarctic oceans have a slight surface warming. The sea level trend is not changing as IPCC model data indicate. The Arctic September sea-ice varies but its area has the last 4 years been much larger than modelled by the IPCC. The average snow cover on the Northern Hemisphere is fairly constant during the last 50 years. The number of tropical cyclones varies, but with no clear trend. The integrated cyclonic energy shows some periodic variations, but no trend. Global precipitation has almost zero trend. The global cloud cover decreased from 64 % to 61 % from 1985 to 2020. At the same time the global temperature increased 0.7 C, suggesting a possible relation. The observed sequence: first warming the of the sea surface, then the deeper sea, atmosphere and land suggests that the Sun is the source of warming, modulated by clouds, and there is no manmade climate catastrophe in the foreseeable future.”
CliSci # 449 2026-05-08
Tropical Cyclone Landfall Intensity for Western North Pacific Nations
A new paper examines tropical cyclone landfall intensity and frequency in the western North Pacific (WNP) region. Tropical cyclones (TC) can cause severe financial losses and human impacts. The authors used maximum TC wind speeds observations and track records from 1980 to 2023 to determine TC landfall intensity trends and their frequency. The analysis was conducted by individual nations. The paper reports that landfall trends by nations are insignificant, but significant decreases were found over the northern Philippines and parts of Micronesia. The El Niño-Southern Oscillation (ENSO) has been widely shown to have a substantial influence on WHP TC behavior and landfalls. Lately, El Niño patterns have become more unpredictable and uneven in where they happen and how long they last. The start of emerging TC positions tends to shift northwest during La Nina years and southeastward during El Nino years. TC frequency across the region has been declining, linked to changes in the large-scale atmospheric circulation. The accumulated cyclone energy (ACE), a metric accounting for TC intensity and duration, is negligible. Japan appears most likely to be subject to increased TC landfall frequency and intensity in the near-term. Reduced TC landfall frequency over the Philippines (significant in the nation’s north) is likely heavily influenced by poleward shifts in TC activity, and could become significant in the future over the entire nation if current trends persist.
Scientists Identify Sources of Blue Carbon in Wetland Soils
Scientists of the Australian Institute of Marine Science published a new paper about blue carbon that provides vital insights into how marine ecosystems can naturally contribute to climate abatement on a global scale. This article explains “Blue carbon refers to the "capture" and "storage" of carbon dioxide from the atmosphere by natural plant growth and decay processes that remove greenhouse gases from the atmosphere to mitigate the effects of climate change. During photosynthesis, coastal plants absorb some of the carbon dioxide they take from the air and water around them into their biomass. When this plant carbon becomes buried in soils, it is locked away from the atmosphere for hundreds to thousands of years, a process known as carbon sequestration.”
A step in enhancing this carbon sequestration is determining the contributions of different coastal plants to this blue carbon pool. Using a dataset of coastal soil carbon measurements beneath saltmarsh, mangrove, and seagrass wetlands, the authors found that most soil organic carbon in coastal wetlands come from external sources, rather than the local habitat-forming plants. The paper says “Managing climate-resilient blue carbon seascapes, therefore, requires an awareness of this portfolio of contributors to soil carbon sequestration.” The lead author said "While the source of the organic carbon varied a lot depending on the location and conditions, we found that generally more than half the organic carbon stored in these soils came from plants outside of the wetland—things like seaweeds and land plants growing offshore and upstream,"
Scientists Pulled a 3-million-year-old Climate Mystery out of Antarctic Ice
Antarctic ice cores reveal important information about Earth’s distant past climate, including air temperature and the concentrations of carbon dioxide and methane. Continuous ice core records previously reached back only about 800,000 years. A new analysis comes from the U.S. National Science Foundation’s Center for Oldest Ice Exploration, known as COLDEX. This news release says “New analyses of ancient ice from Antarctica and the air contained inside it are extending the history of Earth’s climate records and expanding researchers’ understanding of how the planet has changed over the last 3 million years.” The findings show the long-term cooling of Earth’s climate during this period has been accompanied by only a modest decline in heat-trapping greenhouse gases in the atmosphere. Earth was much warmer and sea level much higher as recently as 3 million years ago. The cause of that period of global warmth and subsequent cooling has remained a mystery. The scientists used multi-million-year-old ice from Allan Hills, at the margin of the East Antarctic ice sheet. At that location, ice from the Antarctic interior is stranded in mountain ranges at the edge of the continent. Flow patterns deform the originally horizontal layers. The data provide “snapshots” that indicate average environmental conditions at discrete time periods, extending climate records over the past 3 million years. The new data shows that the average temperature of the ocean has declined by 2 to 2.5 degrees Celsius over the past 3 million years. The news release said “long-term average atmospheric carbon dioxide levels have likely remained below 300 parts per million over this time; measured carbon dioxide levels were 250 parts per million 2.7 million years ago and declined modestly by about 20 parts per million until 1 million years ago. Long-term average levels of atmospheric methane remained unchanged at 500 parts per billion. … The implications of the results are that the cooling of the last 3 million years probably involves, in addition to the key role of heat-trapping greenhouse gases, important contributions from other components of the climate system such as Earth’s reflectivity, variations in vegetation and/or ice cover and ocean circulation.”
Livestock, Methane and Climate
A new paper reveals that methane emissions by livestock have a negligible effect on Earth’s temperature. The paper’s abstract says “For example, killing all of the approximately 1.6 billion cattle on Earth in the year 2025, when this paper was written, would only reduce atmospheric methane concentrations enough to change the temperature by ∆T = −0.04 °C.” The introduction of the paper says “Ruminant livestock like cattle, sheep, and goats, emit methane to obtain maximum nutritional energy from their forage.” The fermentation by micro-organisms coverts carbohydrates into nutritional organic molecules. The microorganisms provide proteins and other nutrients when they are digested in subsequent parts of the digestive system. The fermentation process releases methane to the atmosphere. The average time that a physical methane molecule is in the atmosphere is estimated to be around 9.6 years. However, the average time that the atmosphere will be affected by the emission of that molecule before reaching equilibrium about twelve years. The estimated methane due to cattle is about 357 part per billion (ppb), which is 17% of the total methane atmospheric concentration. The estimated methane due to sheep is only 38 ppb, or less than 2% of the total methane. Killing all sheep on Earth may reduce temperatures by 0.004 °C. “New Zealand’s pledge to reduce methane emissions of their livestock by 14% to 24% from those in the year 2017, would change the temperature by ∆T = −0.000005 to − 0.000008 C, far too small to measure. The paper’s summary says “No rational person would invest a single dollar to achieve such insignificant temperature reductions. But some climate policies demand this.”
Canada’s Air Temperature Change by Satellites
The monthly temperature anomaly dataset of the UAH satellite-based lower atmosphere published by Dr. Roy Spencer now includes data for Canada. The temperature anomalies are with respect to the 30-year 1991-2020 average. Spencer wrote “The warmest April in Canada was in 2010 (+2.61 deg. C), while the warmest anomaly out of all months was in January 1981 (+3.75 deg. C). The Canada linear trend from January 1979 to April 2026 is +0.20 °C/decade, which is only a little higher than the global (land and oceans) trend of 0.16 °C/decade. However, the global land only trend is +0.22 °C/decade, which is greater than the Canada only trend. That is, Canada’s lower air temperature has been warming slightly slower than the global land temperature.
CliSci # 448 2026-04-14
The Data Heat Island Effect: Quantifying the Impact of AI Data Centers
A new preprint paper investigates the impact of the continuing proliferation of artificial intelligence (AI) data centers on the local environment focussing on temperature changes. The paper says “Here, we focus our attention on the heat dissipation of AI hyperscalers.” A hyperscale data center is a distributed computing environment and architecture that is designed to provide extreme scalability to accommodate workloads of massive scale. The authors used remote sensing platforms to obtain a robust assessment of the land surface temperature (LST) increase recorded over the last decades (from 2002 to 2024) in the areas surrounding AI data centres globally. LST trends were assessed at over 6,700 data centres located outside of dense urban areas. The abstract says “We estimate that the land surface temperature increases by 2°C on average after the start of operations of an AI data centre, inducing local microclimate zones, which we call the data heat island effect.” Some locations show and increase up to 9°C, and the minimum increase is 0.3°C. The data heat island effect reduces its intensity to 30% within 7 km around the data centres. Data centres are expected to be one of the most power-hungry activities in the next decade. The paper shows the land surface temperature increase induced by the AI data centres with respect to the average LST recorded over those regions for the 5 years prior to each AI data centre start of operations. Using population maps, the authors estimate that up to 343 million people could be affected by the data heat island effects worldwide.
Anthoy Watts wrote this article about the paper. He wrote “The key variable being analyzed is not air temperature in the meteorological sense, but land surface temperature derived from satellite observations. That distinction matters because land surface temperature is extremely sensitive to local surface characteristics. Replace vegetation with buildings, pavement, and industrial equipment, and the measured surface temperature will rise, regardless of whether the underlying atmospheric conditions have changed in any meaningful way.” The classic urban heat island effects (UHIE) typically fall in the range of 4 to 6°C. In that context, the signal around data centres looks like a subset of the classic UHIE.
Social Vulnerability and Mortality Attributable to Non-optimal Temperature in the United States
The objective of this study was to quantify county-level mortality attributable to non-optimal temperature in the United States and examine whether social vulnerability modifies this relationship. The authors analyzer 1514 US counties representing 91% of the 2010 US adult population of ages 25 to 84. Monthly mortality counts for the period 2000 to 2020 were obtained from the U.S. Centers for Disease Control and Prevention The minimum mortality temperature (MMT) was determined and deaths were classified as heat-related or cold-related. Death rates increased at temperatures greater and less than the MMT. The US pooled MMT was 22.7 °C. Most attributable deaths occurred at temperatures below the MMT. The study reported that nationally, an estimated 72,361 cold-attributable and 6,129 heat-attributable deaths occurred annually, equivalent to 40.1 and 3.4 deaths per 100,000 person-years. This is 11.8 cold-related deaths per heat-related death. The most vulnerable counties have a 40% higher death rate, compared to the least vulnerable counties. These counties also experienced higher MMTs.
The Science News section of the March 2026 Friends of Science Quarterly Newsletter featured a review of a similar study of temperature-related deaths in the U.S., but reporting on only cardiovascular disease (CVD) deaths. Both studies were published in first quarter of 2026 but in different journals and they shared the same lead author and six of the contributing authors. The papers used the same data source and analysed deaths at the US county level over 2000 to 2022. The study discussed above of all non-optimal temperature-related deaths reports 11.8 cold to heat-related deaths, while the CVD study reported about 18 cold to heat-related CVD deaths in the US.
New Book: The Frontier of Climate Science: Solar Variability, Natural Cycles and Model Uncertainty
Nicola Scafetta, a climate science scholar at Duke University, has published a new book about climate science. He posted an article about his book on Judith Curry’s blog which provides a synopsis of the book and his purposes for writing it. Scafetta has investigated the interplay between climate dynamics and solar variability in the context of complex systems for over 20 years. In the book’s synopsis, he asks 3 questions:
- How well do we truly understand Earth’s climate?
- What natural forces remain beyond our grasp?
- Is Net Zero the only viable path forward?
The Frontier of Climate Science explores climate dynamics through physics, complex systems, and astronomy, synthesizing several decades of peer reviewed research. The book critically reviews the scientific foundations of modern climate theory, the evolution of IPCC assessments, and the limits of global climate models (GCMs) when confronted with observations. From this evidence emerges a balanced view of climate risk, favoring pragmatic adaptation over narrowly defined policy pathways such as Net Zero.
The Met Office Is Inflating UK Maximum Temperature Records
Chris Morrison wrote for the DailySceptic “Convincing statistical proof has emerged over the last year to show that the UK Met Office is inflating maximum temperature readings to create Net Zero-supporting climate alarm. Over the last 30 years, the Met Office has produced the vast majority of its data from unnaturally heat-ravaged ‘junk’ sites using newly-installed accurate electronic devices able to record one minute heat spikes.” Dr. Eric Huxter examined 340 daily maximum temperature highs recorded across 96 Met Office stations and discovered that these sites showed average short heat spikes around 1.1 °C. He compared the heat spike averages of these stations with a pristine CIMO Class 1 control station. A CIMO Class 1 weather station is the highest standard of meteorological siting, defined by the World Meteorological Organization to ensure minimal environmental interference (like buildings or trees). Morrison wrote “Most of these spikes occurred around daily ‘records’ in junk CIMO Class 3, 4 and 5 locations. These sites have internationally recognised ‘uncertainties’ or possible errors of 1°C, 2°C and 5°C respectively.” Huxter reviewed a year of one-minute temperature measurements of the control station. Comparing the control station statistics with the 340 heat spikes at the largely junk sites that triggered the record high temperatures, he found that they were highly different. The junk stations were much more likely to have more and larger heat spikes. The heat spikes may be from nearby jet engines, solar farms or buildings. The electronic temperature sensors move much quicker than the old liquid-in-glass thermometers so they catch brief exaggerated spikes rather than true ambient air temperatures. Class 4 and 5 stations have increased in number over the last few years and now total 81% of the UK’s network of 400 stations.
Scotland’s Energy Crisis – Lack of Inertia
On 9th March 2026, Net Zero Watch brought the energy system expert Kathryn Porter to Edinburgh, to speak to an invited audience ahead of the Scottish elections in May. The speech discusses the nature of a power grid in general and problems with the power grid in Scotland. She said “Before a generator connects to the grid it must match the grid’s voltage, frequency and phase – that is the peaks and troughs of the waves line up. This process is known as synchronisation.” She explains that ‘inertia’ is a property where a conventional power station resists the changes in electrical alternating current frequency. The large mass of the rotating turbines and generators resist changes of the rotation speed and help to keep the frequency stable. The frequency needs to be stable at 50 Hz in Europe and 60 Hz in the Americas. “Conventional generators also have electromagnetic inertia which means they also support voltage. Voltage can be thought of as the electrical pressure that pushes current through the network. If voltage rises too high or falls too low equipment can be damaged.”
Wind and solar generators produce direct current which is converted to alternating current using electronic devices known as inverters. These inverters are “grid following” i.e. they cannot create the current and voltage wave. There are some efforts to develop grid forming inverters that would do this but there are big challenges in their development and so far, there are no such devices in operation anywhere in the world where they are actually forming the grid. Porter confirmed that the blackout in Spain in April 2025 was caused by a lack of inertia due to too much wind and solar power. Porter wrote “As inverter-based generation increases, frequency and voltage oscillations are becoming more common, and the grid becomes weaker.” Porter also discusses energy security related to oil and gas.
CliSci # 447 2026-03-07
DoE-DeepDive: Tornadoes, Flooding and Droughts, oh my!
The Climate Discussion Nexus (CDN) published a summary of U.S. tornadoes, flooding and drought from the U.S. Department of Energy report about the impacts of greenhouse emissions on the U.S. climate. A weak tornado in a rural area before 1990 would likely not be observed. Now with radar coverage everywhere, all weak tornadoes are recorded. The summary says “But strong to violent tornadoes were always noticed so the count of those should indicate if there are trends.” A chart of U.S strong to violent tornado counts shows a trend line from a count of 60 in 1950 to 27 in 2024, or a decline of 4.4 tornadoes per decade. Another graph of U.S. weak tornado counts shows a downward tend from 1990 to 2024, but it shows a strong upward trend of weak tornadoes from 1950 to 1989. CDN wrote “Once the radar systems were in place the apparent trend disappears, strongly suggesting there were as many tornadoes prior to 1990 but for the reasons listed above, they just weren’t reported.”
For floods in the U.S., some areas show increasing and some areas show decreasing floods. There is no U.S. wide trend in floods. The IPCC says there is “low confidence” of any trend on a global scale. Droughts in the U.S were the most severe in the 1930s in the historical record. The paleoclimate record indicates far worst droughts in previous centuries. “The percentage of the US classified each month as “Very Dry” has declined over 1895 to 2025, according to NOAA.”
Stefani on the Sun vs. CO2 as Climate Drivers
Andy May wrote this review of a new paper by Frank Stefani that compares the solar “aa” index andCO2 emissions to global sea surface temperatures (SST). The solar “aa” index is a measure of the solar-geomagnetic coupling. It has been measured since 1868. The index varies with changing sunspots and the solar wind. The author performs a double regression of the SST data on the geomagnetic aa index and the binary logarithm of CO2. By applying a regression method, weighting factors were applied to the solar index and the CO2 forcing to best fit the SST data. Stefani says that the solar aa index can simulate the SST from 1850 to 1990. After 1990 the role of CO2 in the regression analysis increases significantly.
Stefani then calculated the transient climate response (TCR) of CO2 subtracting the solar aa contribution from the SST and then regressing the remaining temperature on the CO2 data. Stefani then compares his result to several other studies. The TCR is defined as the increase in temperature resulting from a 1% per year increase in CO2 up to a doubling of the CO2 concentration. However, the actual rate of increase in CO2 over the last 50 years was about 0.55% annually. Stefani made no attempt to correct for the difference between the actual CO2 increase and the 1%/y in the TCR definition. He said the value he calculated is a “type of TCR”. OK, but it can’t be compared to other papers that use the usual TCR definition!
‘Internal Noise’ And Volcanic Forcing Can Trigger 10-15°C Greenland Warming Within Decades
During the last glacial period from about 115,000 to 11,700 years ago Earth’s climate had abrupt shifts between cold and relatively warm phases, each lasting hundreds to thousands of years. The rapid transitions from cold to warm conditions are known as Dansgaard-Oeschger (DO) warming events. DO events shouldn’t be confused with interglacial events. Ice-core analyses from Greenland reveal that DO events involved dramatic temperature increases of 10 °C to 15 °C occurring within just a decade or two. This paper uses computer models with realistic volcanic forcing to investigate how volcanoes can trigger DO events. The paper’s abstract says “These simulations are constrained by sulfate records from ice cores, which help estimate the timing of past major eruptions. We investigate how volcanic eruptions may have occasionally triggered abrupt climate change during the last glacial period. Our results show that very large equatorial eruptions can induce large changes in the Atlantic Meridional Overturning Circulation via atmospheric and ocean circulation changes and air-sea buoyancy fluxes, potentially pushing the climate system between persistent warm and cold states lasting millennia.” The simulations also show that unforced natural climate variability can modulate the likelihood of a transition occurring under volcanic forcing. h/t notrickszone.com
Is a 1.1 °C Rise in a Century Unusual?
The global average temperature rise was about 1.1 °C in the post-industrial period. Many people claim that this constitutes a climate emergency. This paper set out to answer the question “Is a 1.1 °C rise in a century an unusual event in a recorded at a single location in a consistent manner over a long period?” If this temperature rise is unusual, then it is reasonable to determine the cause of the rise. If the cause is determined to be mostly human-cause, then it would be reasonable to determine the cost and benefits of reducing the cause. The paper says “On the other hand, if it is not unusual, then we must question the relevance of seeking attribution.” The author used the temperature record derived from the Epica-Vostok Ice core dataset to answer this question. EPICA (European Project for Ice Coring in Antarctica) is a multi-national project for deep ice core drilling in Antarctica.
The paper’s abstract says “The answer is surprising. By considering interglacial onsets and decays as well as intermediating Ice Ages, it turns out that a rise of this amount would have been considered unusual more than 200,000 years ago, but this rise is not unusual in the current interglacial which started some 20,000 years ago with around 16% of all centuries since the last Ice Age exhibiting a temperature rise of at least 1.1 °C. None of these could have anthropogenic components as they pre-dated the industrial era. This result suggests that attempts to partition the current rise into anthropogenic and nonanthropogenic components are questionable given that it is not even unusual.” The author wrote “In other words, a rise of 1.1 °C in the current interglacial is not significant at any accepted level, (normally taken as < 0.05).
Junk Science: Grasslands Could Shrink by Half by 2100 Due to Warming
This article by Anthony Watts shows an Earth.org article that claims grasslands could shrink by half by 2100 as climate change intensifies, is nonsense. Growing solar farms might threaten grasslands, but CO2 emissions will not! The Earth.org article is based on the very alarmist Potsdam Institute’s modeling study. That study projects a contraction of what it calls “safe climatic space” for grazing. Watts wrote, “The study defines narrow thresholds for temperature, rainfall, humidity, and wind speed and then projects that future warming will push large regions outside those bounds. That is not measurement, it is model-driven extrapolation layered onto emissions scenarios extending to 2100. No global dataset is presented showing that grasslands have begun to shrink by anything close to these figures under the roughly 1.2°C of warming experienced since the late nineteenth century.” There is no evidence in the satellite data that warming is causing any negative effects on grasslands. In fact, NASA satellite data shows the elevated atmospheric CO₂ has enhanced photosynthesis and improved plant water-use efficiency, particularly in semi-arid regions where many grasslands are located. Laboratory and field studies indicate that the CO2 fertilization effect generally increases the growth rate of grasses by 20% to 100%, depending heavily on the grass type, water availability, and nitrogen in the soil. Despite the relevance of the CO2 fertilization effect, the Earth.org article does not mention it. Watts wrote “Data from satellite measurements indicates that the globe has increased its green area about 5 percent over the first 20 years of the twenty-first century. The Sahara Desert is becoming smaller as a result.” Grasslands have persisted through warmer and cooler periods throughout the Holocene. Different grasses are adapted to various temperature ranges. If warming does cause a grass type to decline it would be replaced by other grasses more suitable to that climate. The Potsdam study doesn’t consider this outcome.
CliSci # 446 2026-02-23
Clearing Up Some Misconceptions about the DoE Report
Dr. Ross McKitrick wrote an article to correct misconceptions that are found in the media about a report on the impacts of greenhouse gas emissions on the climate of the United States. The DoE climate report was requested by the U.S Energy Secretary and a draft report was published in July 2015. The report was written by Ross McKitrick, Judy Curry, John Christy, Steve Koonin and Roy Spencer; the “climate group”. Two environmental groups sued the Department of Energy alleging the climate group wasn’t legally constituted. A court judge ruled against the DOE and ordered the work suspended.
It is alleged that the climate group was secretive. However, comments on the DoE climate report and the responses would be published. McKitrick said the process “was far more transparent than either the IPCC or academic journals.” Some say the report is “attacking climate science.” McKitrick countered “We aimed to explain important topics and lines of evidence that have typically been downplayed in public discussions, in other words to broaden the scientific discussion, not attack it.” It was alleged that the report attacks the Environmental Protection Agency’s (EPA) endangerment finding (EF). Actually, the climate group was kept well away from the EF reconsideration process and they didn’t know what they were doing. Some claim that the Trump administration abandoned the DOE climate report. McKitrick wrote “No, the EPA neither accepted nor rejected it because they concluded they lacked statutory authority to do either. The rescission of the EF was based on recent court rulings that limit U.S. Agency powers to regulate in areas not specified in legislation. The EPA concluded they lacked regulatory authority over greenhouse gases, so neither can they issue findings on climate science.”
Fire Dynamics and Temperature Reconstruction at New Brunswick
Scientists extracted a core sample from a lake near Fredericton, New Brunswick, Canada to investigate the fire dynamics and temperatures over the last millennium. A high-resolution pollen analysis was performed on the core. The core bottom dated to AD 890. The temperature reconstruction clearly showed the Medieval Warm Period (MWP: AD 900-1400) and the Little Ice Age (LIA: 1400-1850). The MWP had an average spring temperature of 3.2 °C and the LIA had an average spring temperature of 2.2 °C. The temperature difference between the MWP high at ~950 and the LIA low at ~1800 was ~1.2 °C. Strangely, the core data didn’t show a significant temperature rise from 1850 to now. However, the HadCRUT5 data set shows a 2.2 °C temperature rise from 1850 to 2022. From 1979 to 2022, the satellite dataset UAH6 trend is only 53% of the land surface HadCRUT5 temperature trend, likely due to the urban heat island effect on the surface data. The authors warn “A major issue in doing climate reconstructions based upon modern pollen-climate calibration sets arises because human-caused landscape disturbance is so severe in much of the world that vegetation no longer reflects climate in the same way that it used to prior to this severe anthropogenic disturbance.”
Charcoal analysis showed that natural forest fires had a continuous presence over the past millennium, with higher frequency during the LIA than in the MWP. The core data suggest that the MWP was warmer and drier than the LIA with a high proportion of hardwoods. The authors suggest that the hardwood-heavy composition of the Acadian Forest during the MWP limited the conditions conducive to fire, as deciduous trees are generally less combustible than conifers on account of the greater moisture content of their leaves.
CO2 Caused the Boreal Forests to Grow 12% Since 1985
The boreal forest is the world's largest land-based biome, forming a massive, circumpolar ring across the Northern Hemisphere (Canada, Russia, Scandinavia) just south of the Arctic. This study used Landsat, Earth's longest-running record of global, high-resolution (30 m) satellite imagery, to study how the boreal forest has changed from 1985 to 2020. The paper says “This pan-boreal time series was then subjected to trend analysis to estimate and map the historical direction, rate, and significance of change across the region, and the resulting estimates of forest age were used to infer impacts on the region's carbon budget.”
The study reported that the boreal tree cover expanded from 7.15 million km2 in 1985 to 8.00 million km2 in 2020 which is at 12% increase. The mean latitude of tree cover increased by 0.29°. Net gains from 1985 to 2020 occurred at all latitudes above 53° N, with the strongest increases concentrated between 64 and 68° N. In addition to area growth, the dataset revealed widespread increases in tree-cover density. Younger forests are becoming more common. Because of how they grow, they are much better at quickly soaking up carbon dioxide (CO2). Young forests already contribute significantly to the region's carbon sink. Both climate warming and CO2 fertilization are expected to continue enhancing productivity. Recent evidence shows that species diversification is strongest near the tundra margin as temperate species colonize newly viable habitat. The enhance number of species may improve ecological resilience.
New Climate Models Sheds Light on Long-standing Pacific Puzzle
Climate models used in the last IPCC report did a horrible job of simulating the temperature trends in the eastern tropical Pacific Ocean and the Pacific sector of the Southern Ocean. Climate scientists have long been puzzled by the large discrepancy between observed cooling trends in these ocean regions and climate model simulations. The climate models show warming but the measurement show cooling over the last 45 years. Researcher at the Max Planck Institute for Meteorology used a new climate model with unprecedented resolution of 5 km in the oceans and 10 km in the atmosphere. The high resolution allows the model to better simulate basic processes and they have successfully reproduced the observed sea surface temperature patterns. The paper says “Mesoscale ocean eddies, a few tens of kilometers in size, are ubiquitous in the Southern Ocean and play a key role in poleward heat transport, but they are not represented by coarser-resolution CMIP models.” The “eddies move heat poleward across the Antarctic Circumpolar Current (ACC). … The simulation shows that, as the Southern Ocean is exposed to a warming atmosphere, poleward heat transport by eddies across the ACC weakens. At the same time, excess heat supplied by the atmosphere is promptly transported away by the ACC to other basins. Ultimately, this dynamical interplay cools the top 2,000 m of water in the Pacific sector of the Southern Ocean and causes the ACC to shift northwards, thus expanding the ocean area covered by polar waters. Cooling is communicated to the subtropical Pacific through its connection via both oceanic and atmospheric pathways from the Southern Ocean. This strengthens the already existing high-pressure anomaly off the South American coast. As a result, southeasterly trade winds blowing from there towards the equator intensify; they cool the sea surface through evaporation and create low stratocumulus clouds that reflect incoming solar radiation, contributing to further cooling.”
CliSci # 445 2026-02-04
Historical CO₂ Levels in Periods of Global Greening
Atmospheric increase in carbon dioxide (CO2) has caused a 30% increase of terrestrial Gross Primary Production (GPP) since 1900, otherwise called global greening. This paper raises an important question; Is an increased CO₂ level also a necessary condition for a large increase of GPP? The paper’s abstract says ”This paper evaluates whether CO₂ levels during historical periods of similar or more greenness as today, are consistent with the widely held view that CO₂ levels remained below 300 ppm over the past 800,000 years, as indicated by Antarctic ice core records. This research uses eight long-term GPP datasets to model the global GPP response to increasing CO₂ levels. The paper shows “a diminishing return of increasing vegetation growth associated with rising CO₂ levels, as additional factors such as nutrient and water availability impose constraints on the fertilization effect.” It also shows that the average residence time of CO₂ in the atmosphere increases with higher GPP values. The CO₂ residence time is equal to the total atmospheric CO₂ mass divided by the global down flux per year. The research leads to the conclusion that high CO₂ levels in the past, similar to today’s CO₂ levels, were necessary for comparable GPP during green periods like 10,000 years ago. Around 10,000 years ago, forest cover was 50% greater than today. The global terrestrial GPP was 4.4% larger in that period than today. The paper says “A CO₂ concentration of 280 ppm would only be possible if nature’s response to CO₂ were fundamentally different from what we observe today, with other constraining factors exceptionally more favorable. Natural fluctuations of the atmospheric CO₂ concentration can be well explained, based on the strong temperature dependence of the degeneration of carbon compounds that are stored in large quantities in the soil and the oceans.”
The paper’s conclusion states “The global GPP is by far the most important component of the down flux to land and oceans. As the CO₂ concentration is proportional to the down flux and the residence time, a ‘green Earth’ is inextricably linked to high atmospheric CO₂ concentrations. The current level of Earth's greenness is not extraordinary, suggesting that the present atmospheric CO₂ concentration is also not exceptional.” It is “unlikely that historical CO₂ levels were as low as generally accepted. … This conclusion contradicts the assumed low CO₂ concentrations in the past 800,000 years, based on the ice core records from Antarctica. … Several studies have raised serious questions regarding the accuracy and reliability of ice core data, especially with respect to the dissolvement of CO₂ in melting water the many years before the air bubbles in the ice are fully closed.”
A Limit of Wind and Solar Power in Belgian Electricity Grids
This article by Dr. Pierre Kunsch, translated from French, describes the problem of allowing too much intermittent renewable energy on the European electricity grids and in Belgium in particular. The article states “The blackout of April 28, 2025, in Spain and Portugal demonstrated that there is a limit that must not be exceeded for their installation on transmission and distribution networks.” Wind and solar power are too irregular to be viable replacements for domestic thermal power plants. The article demonstrates that the proportion of total electrical energy consumption from the electrical grid should not exceed 10%. The Belgian electricity mix in 2021, before the nuclear phased-out began, with that of 2024, after the shutdown of two reactors. The nuclear reactors produced up to 6 GW of dispatchable power in 2021 and 4 GW in 2024. Wind and solar power were given priority access to the grid. The article shows graphs of electricity production by power source over 2021 and 2024. There are numerous gaps in the production histories which indicate insufficient production from domestic sources. Load curve graphs show the hourly electrical energy data in descending order over the hours of the two years. The consumption at the top of each graph is compared with the total hourly production of the stacked dispatchable sources and the stacked non-dispatchable renewable energy sources.
Between 2021 and 2024, total consumption decreased slightly from 85 to 81 TWh/yr. Domestic dispatchable sources contributed 91% in 2021 and only 63% in 2024. The imports increased dramatically from 1% to 14% of total consumption while exports fell from 11% to 2%. The peak power consumption is almost the sum of the maximum dispatchable capacities and imports. The contribution of non-dispatchable capacities to cover the power peak is very small in both years. In the absence of sufficient dispatchable capacity, Belgium must import dispatchable power from its neighbours. The article’s conclusion says “The significant intermittent capacity did not replace them; it was simply added on top of them without any substitution. Thus, capacity between 13 and 14 GW – originally entirely dispatchable before the introduction of intermittent sources – was almost doubled in 2024, without any increase in domestic production. … Domestic production, which remained above consumption until 2021, fell by 23% and is now below consumption, which itself fell by 'only' 4%. … The CO2 emission intensity has decreased only marginally by 3%.” Intermittent capacity is not replacing the lost dispatchable capacity. Its significant growth has created a new risk: increased dependence on imports. All base load power consumption should be met solely by dispatchable sources. For peak demand flexible energy sources are needed, primarily gas turbines without a steam cycle. The article further shows that intermittent sources should be limited to 9% of total annual power consumption.
Dutch Climate Skeptics Vindicated: KNMI reinstates Seven pre-1950 Heatwaves
The Royal Netherlands Meteorological Institute (KNMI), the national weather and climate institute in The Netherlands, admitted publicly that a group of four skeptical scientist were right in their critique of KNMI’s temperature adjustment. Seven years after Dutch skeptics first challenged KNMI’s temperature adjustments, the institute has reinstated seven “lost” pre-1950 heatwaves, validating claims of over-correction that had erased 16 out of 23 historical temperature extremes. This article by Marcel Crok of CLINTEL explains that “in 2016, KNMI homogenized their daily temperatures for the period 1901-1950 because of a change in measurement method in 1950 and a displacement 300 meter towards open field in 1951.” The temperature adjustment involved comparing a station at De Bilt with a station 150 km northeast of it. Crok wrote “The hottest days of the year in the period 1901-1950 were corrected downwards by up to 1.9oC. Because of this, 16 out of those 23 heatwaves vanished from the official records.” KNMI then started to claim the “that heatwaves nowadays are much more frequent than in the past.” The four climate skeptics, including Crok, wrote a report about the adjustments that showed the KNMI has over-corrected far too much. Two KNMI representatives told Crok that they wouldn’t response to the extensive report as they didn’t trust him. In December 2021, the skeptics published at paper in the journal Theoretical and Applied Climatology. Crok wrote “In the paper, we presented irrefutable evidence that, as a result of the corrections, De Bilt had become an outlier compared to the four other principal stations we have in the Netherlands.” In response to a press release about the paper, a newspaper asked for a reaction from KNMI. They promised to look into it in 2022. In October 2025, KNMI asked the skeptics to review their new homogenization, which recognized the validity of their criticism. Crok wrote that a Dutch climate journalist “interviewed both me and KNMI and his headline was simply amazing: KNMI ‘Discovers’ Seven Pre-1950 Heatwaves: A Win and Point of Principle for Climate Skeptics.”
New Manual on Scientific Evidence: Smart People Get Hoodwinked by the Climate Charlatans
The US Federal Judicial Center (FJC) published a document for the US Courts titled “Reference Manual on Scientific Evidence”. The purpose is to help judges who are not trained in science decide cases involving complex scientific evidence. Francis Menton wrote “In this latest version of the Reference Manual, the FJC has totally lost its way. Somehow, it got captured by a clique of climate charlatans who have inserted a lengthy section that is anti-science and based on logical fallacy. And many dozens of seemingly smart people who were supposedly reviewing this have gotten hoodwinked.” One sub-section of the manual titled “Science Investigates Testable Hypotheses” describes the scientific method. It says that a testable hypothesis must generate specific predictions which needs to be compared to a set of observations. If the prediction is inconsistent with observations, then the hypothesis is false. “If an explanation is equally compatible with all possible observations, then it is not testable and hence, not within the reach of science.”
A sub-section of the manual is called “Climate Change Detection, Attribution, and Projections.” Activist climate scientist wrote this section to support litigation seeking to blame weather-related disasters on emitters of CO2. They don’t want storms events to be tested against real observations. Instead, they wrote “[A]ttribution involves sifting through a range of possible causative factors to determine the role of one or more drivers with respect to the detected change. This is typically accomplished by using physical understanding, as well as climate models and/or statistical analysis, to compare how the variable responds when certain drivers are changed or eliminated entirely.” Menton wrote “How about articulating a testable hypothesis and testing it? They will never, ever, ever do that. It could prove the whole enterprise to be wrong!”
Menton wrote in a second post than instead of using real world evidence, “these studies claim to validate their attributions by reference to things like “physical understanding” and models that have not been empirically validated. In other words, rather than using empirical evidence to validate a hypothesis, they use one hypothesis supposedly to validate another hypothesis. They have assumed the conclusion they want to reach. This process is sometimes called circular reasoning.”
New Study Affirms Rising CO2’s Greening Impact Across India
This new study reports that India is the second largest contributor to global greening, and that CO2 Fertilization Effect (CFE) has driven a “substantial expansion of global green cover over the last two decades.” This article says “The authors found the CFE has ‘nearly doubled’ the trend values in net primary production (NPP) across India relative to the trend values when the CFE is not considered.” Plants absorb by photosynthesis about 30% of human-caused CO2 emissions, thereby mitigating climate change. Gross Primary Productivity (GPP), which quantifies the amount of CO2 absorbed during photosynthesis, is a key indicator of land carbon uptake. GPP represents the total energy captured by plants, while NPP is the remaining energy stored as biomass available to the rest of the ecosystem after deducting the energy that is immediately consumed by the plant for living. The study utilizes the Moderate Resolution Imaging Spectroradiometer (MODIS) satellite data to determine trends of NPP in India. The MODIS data indicates the leaf area but does not consider the direct CFE. The study incorporates the direct effect of CFE into MODIS vegetation productivity estimates and reassesses NPP trends across India from 2001 to 2024. The analysis shows that the NPP trend nearly doubled after accounting for the CFE. The southern peninsular India shows only modest NNP trends in response to the CFE likely due to warming. In contrast, NW India where temperature have declined shows a stronger increase in vegetation productivity.
CliSci # 444 2026-01-19
The Epic Climate Model Failure Continues
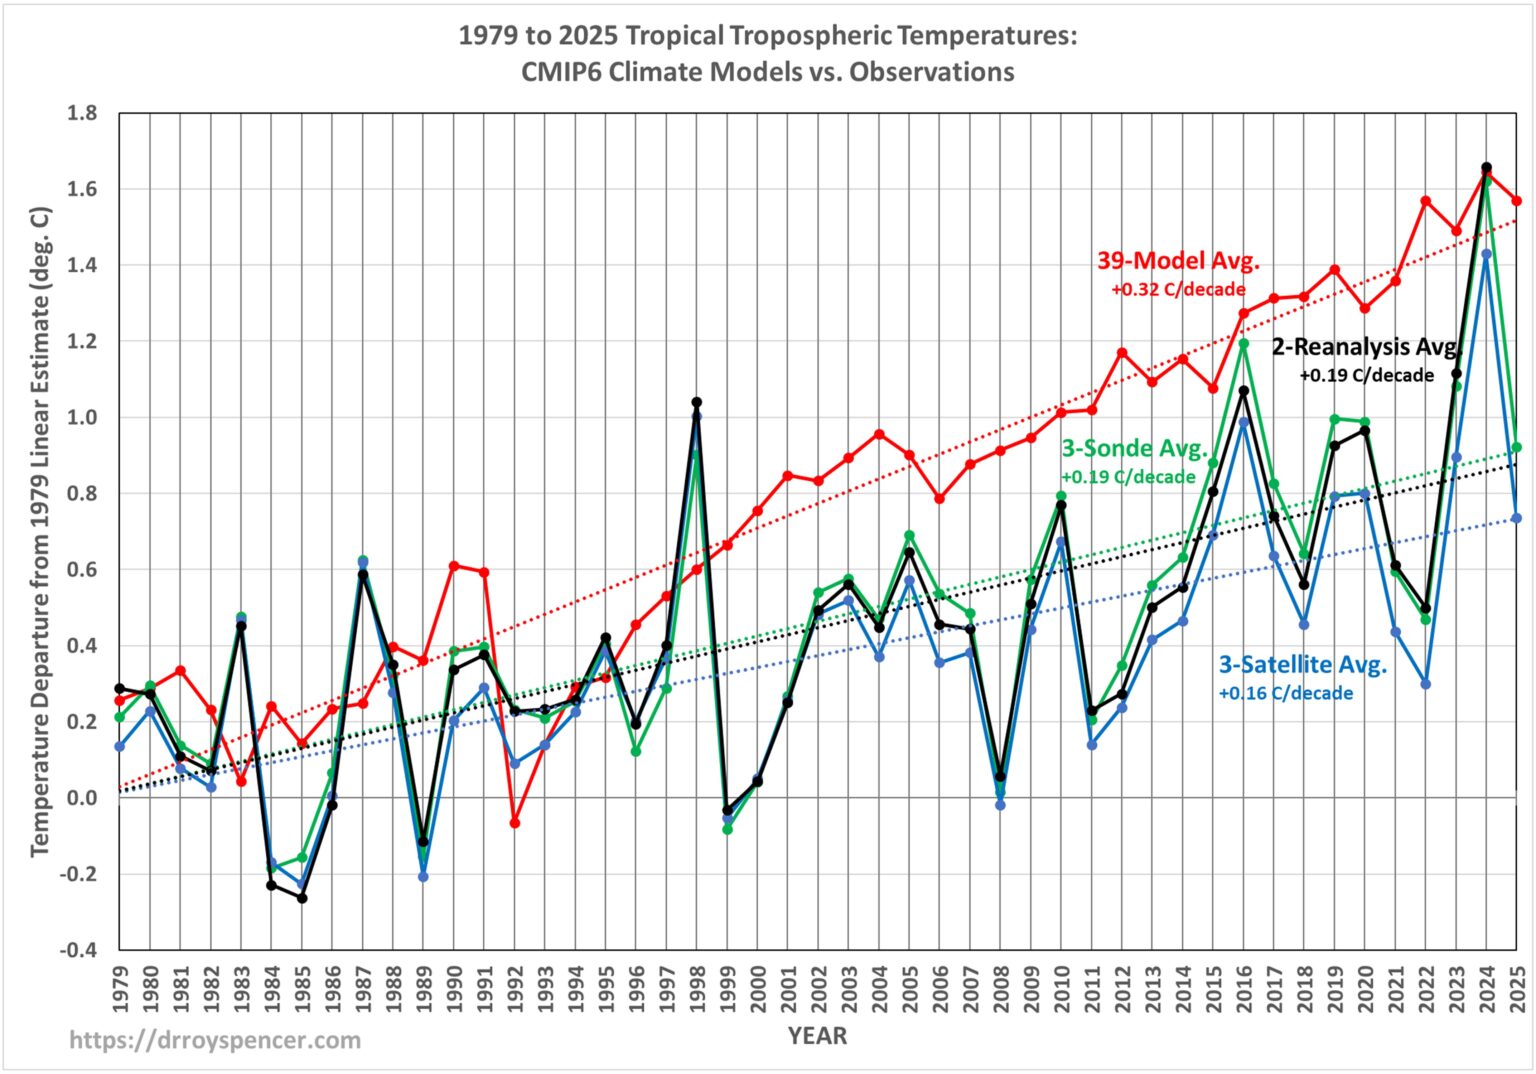
Climate models forecast that the strongest warming response of the climate system to increasing greenhouse gases is in the tropical upper troposphere, which is known as the “tropical hotspot”. Dr. John Christy has updated his graph of the tropical tropospheric temperature trends comparing models versus the measurements as shown on Roy Spencer’s blog. The graph shows the trends from 1979 to 2025 from 39 climate models and measurements from radiosondes (weather balloons), satellites and reanalysis. The radiosonde coverage of the tropics is very sparse. Only the satellites provide complete coverage of the tropics.

Roy Spencer wrote “Amazingly, all 39 climate models exhibit larger warming trends than all three classes of observational data.” The two Canadian climate models, CanESM5 and Can5-OE, produce trends of 0.505 and 0.453 °C/decade, respectively. The three observation types, sonde, reanalysis and satellite, give trends of 0.192, 0.185 and 0.155 °C/decade, respectively. The average trend of the 39 models is 0.317 °C/decade and the average trend of the measurements is 0.177 °C/decade. The Canadian model CanESM5 produces a trend that is 2.85 times the average observations. The climate model average trend is 1.78 times the average observations. Spencer explains why the climate models give excessive warming trends. He wrote “The excessive warming of the tropical troposphere is no doubt related to inadequacies in how the models handle convective overturning in the tropics, that is, organized thunderstorm activity that transports heat from the surface upward. That ‘deep moist convection’ redistributes not only heat energy, but clouds and water vapor, both of which have profound impacts on tropical tropospheric temperature.”
Spencer also presented a time series graph showing the 30-model average trend and the trends of the three observation types. The unusually warm year of 2024 really stands out but in 2025 the measurements return to their trends.
Offshore Wind Turbines Steal Each Other’s Wind: Yields Greatly Overestimated
A new study using an analytical model of wind farms shows that national policy targets assume up to 50% more energy production than what can be achieved. The model was validated by energy data from 72 windfarms. The study says “Such overestimation not only hides true energy costs but also underestimates power variability, integration, and curtailment risks, and it distorts policy pathways. When projections exceed physical limits by such margins, the resulting electricity shortfall can destabilize decarbonization strategies and reach deep into society and the economy.” The paper’s summary says “The model clarifies the critical design trade-offs between turbine height, specific power, and wind farm density. Our model provides a rigorous yet simple framework, readily usable by engineers, planners, and policymakers to forecast wind farm performance, support system planning, and to set realistic targets consistent with aerodynamic limits.” The paper’s conclusion says “This study establishes a physically grounded upper limit on wind farm performance, demonstrating that aerodynamic constraints impose a fundamental ceiling on the energy extractable from the marine atmospheric boundary layer.”
The study is discussed in this article by Bert Weteringe, an expert on wind turbines. "Wind turbines literally steal each other’s wind, which means that the efficiency of wind turbines will decrease even further as their number increases. In seven of the nine case studies, the national policy targets for offshore wind yields turned out to be way overestimated." The resulting shortfall in electricity revenues "could have a profound impact on society and the economy."
Save LBI Says Offshore Wind Projects Grossly Underestimate Harm to Marine Mammals
Save Long Beach Island, Inc. (Save LBI) is an organization dedicated to preserving the shore and ocean environment. It contends that the high levels of noise generated during the surveying, construction, and operation phases of an offshore wind project have a detrimental effect on sea mammals. This article says “Because hearing acuity plays a central role in the ability of a whale or dolphin to navigate its surroundings — especially during migration — elevated noise can cause serious harm, including impaired or permanent hearing loss, and behavioral disturbances that can also lead indirectly to harm and death.” For years, NOAA has ignored research presented by Save LBI. The organization has recently petitioned NOAA to overhaul the flawed methodology being used for calculating “Takes” — instances of fatality, serious harm, or behavioral disturbance to whales and other marine mammals. The petition cites major scientific and mathematical errors in NOAA approved “Take estimation” methods and presents calculations that show significant harm and disturbance to whales and other mammals in the vicinity of offshore wind projects. Save LBI has also asked NOAA to require a monitoring program that will either verify the calculations in its Take estimation method or revise those methods. The program should provide data to verify noise reduction assumed from using bubble curtains around the pile driving operations, as well other noise-related parameters. Save LBI President Bob Stern said “We ask them to put forward a monitoring program in conjunction with that review that will either verify or disprove the concerns we have raised. If our concerns are verified, then NOAA should define and require the use of new mathematically and scientifically defensible methods for calculating marine mammal Takes.”
Climate Alarmism’s Credibility Sinks Under Weight of Ecological Evidence
This article by Vijay Jayaraj shows that the climate alarmism and the climate emergency, which are built on flawed computer models, are collapsing under the weight of the reality of good environmental news. Jayaraj wrote “For decades, activists have anchored their case in dramatic warnings about species extinction, melting ice caps and the end of polar life, failing ecosystems and vanishing biodiversity. The goal was to spread fear. The world’s largest nations have actually expanded their forest area significantly. Between 2015 and 2025, China added approximately 4 million acres of forest while Russia gained more than 2 million acres and India gained nearly a half million acres of forest. Polar bear populations have not declined over the last 15 years despite dire predictions. Between 2014 and 2022, the number of India’s tigers grew from 2,226 animals to 3,682. This represents a 65% increase over eight years, with an annual growth rate exceeding 6%. species extinction rates have not accelerated. Instead, they peaked over a century ago and have been in decline since the early 1900s. The great die-off turned out to be a phantom. Past extinctions were largely driven by invasive species on isolated islands, not by habitat loss or the alleged ‘climate crisis’. Famine failed to materialize as farmers across the globe brought in record harvests. Crop yields have increased substantially, enabling farms to feed more people while using less land. The new media is silent about these victories. These stories are buried because they don’t sell fear.
CliSci # 443 2026-01-03
2025: Lowest Global Death Rates from Extreme Weather in History
“Globally, 2025 has had one of the lowest annual death rates from disasters associated with extreme weather events in recorded history.” This good news was reported by Roger Pielke Jr. using data from the Centre for Research on the Epidemiology of Disasters (CRED) in Belgium. The CRED data indicated about 4,500 global deaths related to extreme weather event through October 2025. Reports estimate that about 1,600 people lost their lived in the final two months of 2025, which was mostly due to flooding in south Asia associated with Cyclones Senyar and Ditwah. If those estimate prove accurate, the total 2025 weather-related deaths would be 6,100. This number is similar to some recent years, but the death rate from extreme weather events is the lowest ever at less than 0.8 deaths per 100,000 people (with population data from the United Nations).
Pielke wrote, “To put the death rate into perspective, consider that:
- in 1960 it was >320 per 100,000;
- in 1970, >80 per 100,000;
- in 1980, ~3 per 100,000;
- in 1990, ~1.3 per 100,000;
Since 2000, six years have occurred with <1.0 deaths per 100,000 people, all since 2014. From 1970 to 2025 the death rate dropped by two orders of magnitude. This is an incredible story of human ingenuity and progress.” Extreme temperature event impacts (cold and hot) are not included here.
The declining death rate from weather events is due to reduced vulnerability and improved preparation for extreme events. Pielke wrote “Underlying this trend lies the successful application of science, technology, and policy in a world that has grown much wealthier and thus far better equipped to protect people when, inevitably, extreme events do occur.”
The Record Hot UK Summer of 2025: Validation of the UKMO Methodology, but the Record Was Only in Tmin
The UK Met Office (UKMO) reported that 2025 was the UK’s warmest year on record with an average temperature of 10.09 °C. However, the UKMO’s methodology of averaging the temperature record from surface temperature stations has been criticized. Many temperature stations do not meet the World Meteorological Organization criteria for a good climate monitoring station and many UK stations have closed in recent years, and so those stations’ temperatures are estimated from surrounding stations. Temperature monitoring stations come and go over time, and this can introduce biases that change over time and corrupt long-term estimates of temperature change. Dr. Roy Spencer wrote “How one accounts for, and adjusts for, these changes is not a settled matter.” The UKMO evaluates how station temperatures vary with latitude, longitude, elevation, proximity to the coast and land use to remove relative biases between stations. These adjustments are applied to stations surrounding closed stations which are then averaged to estimate temperatures at closed stations. This technique is intended to avoid the biases caused by closing stations.
Spencer tested the UKMO methodology by comparing its results to a his “relative bias removal method”. He starts with the 3 stations having the longest continuous records in all 126 years from 1900 to 2025 in the UK and averages them. Spencer explains “Then, I take the station(s) with the next-longest record (Oxford, 124 years), compute the average difference with the original series, and add it to the series to make a new 4-station average. This is done sequentially for all (148) stations in the UK since 1900 that have at least 2 years of record, going down the list from the longest periods of record to the shortest.” This method produces yearly summer-average temperatures that are nearly identical to the UKMO methodology. Spencer concluded “In both my and the UKMO analysis, 1976 (not 2025) was the hottest summer in daily high temperatures (Tmax), with 2025 taking 3rd or 4th place; the “record” hot year of 2025 was due to nightly low temperatures (Tmin) being anomalously warm. The average of the three hottest daytime temperatures in each summer month put the summer of 2025 in 4th place since 1960, behind 1976, 1995, and 2022 (which were essentially identical).” Neither Spencer’s nor the UKMO method accounts for an increasing urban heat island effect nor changes in instrumentation types that could cause spurious warming in the record. Increases in nightly low temperatures are beneficial as the number of cold-related deaths are around 50 times that of heat-related death in the UK.
Hunga Tonga Volcano Likely Caused the 2023 Exceptional Warming
An eruption began on the submarine volcano Hunga Tonga–Hunga Haʻapai on 20 December 2021 and reach a very large climax explosion on 15 January 2022. The eruption likely cause the exceptional climatic warming event of 2023 according to an article by Javier Vinós. The author wrote “It is clearly a naturally occurring, externally forced climate event. However, mainstream climate scientists are not treating it appropriately.” The 2023 warming resulted in 2023 and 2024 being the warmest years in the global surface temperature record. The biggest global low cloud cover anomaly ever recorded occurred in 2023. The climate models can’t explain the extraordinary 2023 ocean warming. The caption to this plot says “The 2023 climate event can be seen most clearly in the global sea surface temperature anomaly (NOAA, 60°N–60°S, baseline 2021). It began in December 2022. By November 2025, 90% of the warming from the 2023 event has disappeared. A 2024 study found only a 0.2 % probability that the 2023 warming could be due to the unforced internal variability and the forced greenhouse gas-induced trend. Vinós explains that the El Niño in 2023 cannot be held responsible for the warming as it was too weak. The anthropogenic forcing by greenhouse gases and urban warming is small and constant, and can only produce noticeable changes over long periods of time. Maritime fuel regulations that came into force in 2020 caused an abrupt reduction in sulfur emission, but this couldn’t be a major cause of the 2023 event because its warming effect is permanent, whereas the ocean warming was reversed in 2024 and 2025.
The 150 megatonnes of water vapour that the Hunga Tonga underwater volcano injected into the stratosphere are unprecedented. Vinós wrote “Climate models do not adequately reproduce the effects of the 1815 Tambora eruption, suggesting that dynamic atmospheric changes caused by stratospheric eruptions or other factors have a much greater impact on climate than previously thought.” Therefore, the climate models can’t directly be used to explain the effects to the Hunga Tonga eruption. The 2023 warming was directly caused by the drastic decrease in global cloud cover. However, scientist still do not know what controls changes in cloud cover. Wind speed has a greater impact on evaporation than temperature or humidity. A change in wind caused by the Hunga Tonga eruption might cause changes in evaporation, cloud formation and their distribution. If the Hunga Tonga eruption caused the 2023 warming, we should observe most of this warming disappear in 3-5 years. This projection does not arise from any of the other considered causes. By December 2025, four years after the eruption, this prediction had come true. 90% of the ocean warming from the 2023 climate event has disappeared. The Hunga Tonga eruption is currently the best explanation for the 2023 climate event.
Climate Models Underestimate the Cooling Effects of Southern Storms
A new study in Nature Geoscience shows that current climate models “underestimate the strength of Southern Ocean storms and thereby simulate an overly warm ocean.” A news release about the study says “storms play a key role in controlling how the Southern Ocean exchanges heat with the atmosphere. The team finds that intense winds churn the ocean, drawing colder deep water upward and pushing warmer surface water downward. The surface stays cooler and can take up more heat from the atmosphere.” The abstract says “The Southern Ocean absorbs most of the excess heat resulting from climate change. However, climate projections show a persistent warm summer bias in its sea surface temperatures, indicating a limited understanding of the air–sea heat exchange mechanisms governing this region. … Our results demonstrate a causal link between storm forcing and sea surface temperature variability, which is critical for reducing warming biases in climate models and improving future climate projections.” The research team have been studying storm patterns around Antarctica over the last few decades and can now link changes in storm intensity and their windiness to changes in our climate and atmospheric circulation. It's in the Antarctic summer that storms have their strongest impact on ocean heat uptake.
No Hurricanes Strike USA For 1st Time in a Decade
For the first time in a decade, not a single hurricane struck the U.S. this season, and that was a much-needed break. This is according to NOAA’s administration Neil Jacobs as reported by the RigZone website. The official hurricane season for the Atlantic basin is from June 1 to November 30. A tropical storm caused damage and casualties in the Carolinas, distant hurricanes created rough ocean waters that caused property damage along the East Coast, and neighboring countries experienced direct hits from hurricanes,” Jacobs said in the statement. The NOAA statement noted that the Atlantic basin produced 13 named storms. Of these, five became hurricanes, including four major hurricanes, NOAA highlighted, pointing out that an average season has 14 named storms, seven hurricanes, and three major hurricanes. Hurricane season activity was near-normal for both the Eastern Pacific basin and Central Pacific basin and fell within predicted ranges. Linnea Lueken of Climate Realism noted that neither RigZone nor NOAA credits climate change nor do they try to attribute hurricanes to climate change. Lueken wrote about the RigZone post “The whole post is factual and straightforward. Climate change is not making hurricanes worse; it is simply not evidenced in the data.” This is good reporting for a change. Lueken wrote “Earlier in the season, Climate Realism addressed some of the false claims regarding Hurricane Melissa and Erin, particularly when media claimed that ‘rapid intensification’ was due to climate change. That was false, no real-world data backed the assertion, only misleading and corrupt attribution models that over-emphasize water temperature and downplay other factors that influence hurricane strength and formation.”