Ken Gregory, P.Eng.
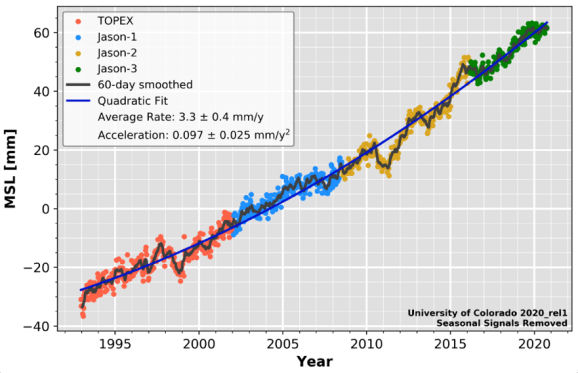
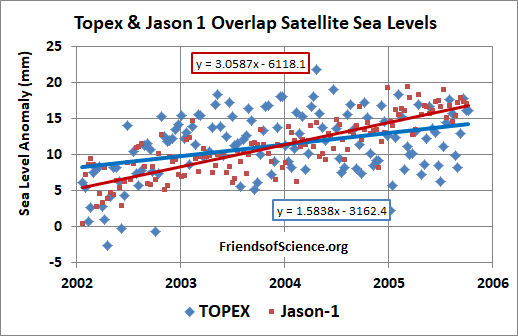
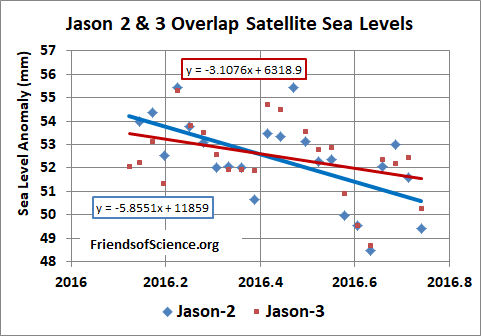
An article authored by Willis Eschenbach here examined the satellite data used by the University of Colorado to calculate the global sea level rise and its acceleration. He wanted to know why the satellite data show much larger acceleration than the tide gauge data. The satellite data are composed of measurements from four satellites operating over different time periods with some overlap. Willis plotted up the satellite data and fitting linear trends to each set of satellite data. The linear trends of the Topex, Jason 1, 2 and 3 satellites are 2.6, 2.5, 4.1 and 3.7 mm/yr, respectively. Willis claimed he found the answer by saying the acceleration is so great because the two most recent satellites show trends that are significantly larger than the earlier two satellites. But that is no explanation because if there were actually sea level rise acceleration the linear trend at the later period would indeed be greater than the earlier period. This doesn 't show that there is anything wrong with the calculated acceleration of 0.097 mm/yr2. However, the linear trend of the satellite data during the periods of their overlaps should be the same if the satellites were calibrated correctly. I created graphs of the Topex/Jason1, Jason1/Jason2 and Jason2/Jason3 overlap periods. The differences between the latter and the earlier satellite trends over the overlap periods are 1.47 mm/yr, 0.33 mm/yr and 2.75 mm/yr. The increase in trends over the three overlay periods sum to 4.55 mm/yr. The overlap periods are 3.7 yr, 4.9 yr and 0.6 yr. The trend difference of the overlap period of Jason2 to Jason3 is very uncertain due to the short overlap. Even ignoring the last overlap, the trend increases by the failure to match the trends of the data over the overlaps of the first three satellites is 1.81 mm/yr. Therefore, most of the sea level acceleration of the reported satellite data is bogus and is due to the failure to properly calibrate the satellite data. The acceleration indicated by the best quadratic fit to 63 long tide gauges is 0.013 m/yr2, which is 13% of the acceleration reported by the University of Colorado satellite data.

Figure 1; University of Colorado sea level data showing an acceleration of 0.097 mm/yr2.

Figure 2; Overlap trends of Topex and Jason 1 satellite date. The trend of Jason1 is 1.47 mm/yr larger than that of Topex during the overlap period.

Figure 3; Overlap trends of Jason 1 and Jason 2 satellite data. The trend of Jason 2 is 0.33 mm/yr larger than that of Jason 1 during the overlap period.

Figure 4; Overlap trends of Jason 2 and Jason 3 satellite data. The trend of Jason 3 is 2.75 mm/yr larger than that of Jason 2 during the overlap period, but uncertainty is high due to the short overlap period.

Figure 5; Sea level rise measured by 63 long tide gauges indicating an acceleration of 0.013 mm/yr.
