
By: Ken Gregory, P.Eng.
CliSci # 295 2018-12-28
Dry Land Areas Are Getting Wetter
The Intergovernmental Panel on Climate Change in 2013 concluded that there was low confidence that any significant trends in drought could be detected or attributed to climate change (warming). Nevertheless, numerous media reports claiming that droughts are getting worse, such as here. Drought is caused by a decline in precipitation and/or an increase in evaporation. The global precipitation data over land from the Climate Research Unit in England for 1901 to 2016 gives a trend of 0.23 mm/month per decade, which is small. The average global precipitation over the last 30 years (1987-2016) was 70.0 mm/month. One might expect that global precipitation would correlate well with temperature, as higher temperatures should cause more evaporation. However, the global precipitation correlates very poorly with global temperatures, with a R2 = 0.107. (R2 = 1 is prefect correlation, R2 = 0 is no correlation).
Willis Eschenbach did an analysis of precipitation versus the trend of precipitation from 1980 to 2016 to determine if dry areas are getting drier. His plot shows that there is no trend of the areas with the lowest precipitation (less than 17 mm/month), and the areas with precipitation between 17 and 67 mm/month have a positive average trend of about 0.4 mm/month per decade. Willis writes What this shows is that while the wetter areas are getting wetter, it is not true that the drier areas are getting drier. On average, all areas are getting more rain. Not a lot more rain, of course, but more rain. Once again, the climate models are wrong. He made a similar plot using the Tropical Rainfall Measuring Mission satellite rainfall dataset which covers the land and oceans region 40 °N to 40 °S for the period Dec 1997 to Mar 2015. Again there is no trend in precipitation for the driest regions and the trend of areas with precipitation between 17 and 67 mm/month have a positive trend of 0.06 mm/month per decade.
Coral Reefs Recover Rapidly From Warm Temperatures
Peter Ridd, recently a physicist researcher at James Cook University, reports that coral reefs rapidly adapt to higher temperatures. This makes them less susceptible to bleaching damage from warm ocean temperatures in the future. He writes This is why corals are one of the least likely species to be affected by climate change, irrespective of whether you believe the climate is changing by natural fluctuations or because of human influence. Microscopic plants called zooxanthellae live in the corals and give the coral energy from photosynthesis. If an El Nino event warms the water the plants become poisonous to the coral and they are rejected which turns the coral white. The corals take in new zoozanthellae that are suited to the warmer temperatures. This transformation can take just a few weeks. Deep water coral to 40 m have fall less bleaching than near surface corals. Ridd estimates that the 2016 bleaching event caused less than 8% of Australia 's Barrier Reef to die. He says there was a 250% increase in coral between 2011 and 2016 for the entire southern zone. Some scientists falsely claimed that coral bleaching is a man-made phenomenon but a recent study of 400-year-old corals found that bleaching is no more common now than in the past. Peter Ridd was fired from James Cook University for finding errors in published papers and telling the truth about coral reefs.
Extra CO2 Increased Red Spruce Forest Growth 106% Since 1989
Dr. Craig Idso of CO2 Science reviewed a study by Mathias & Thomas 2018 that found that the rise in CO2 since 1989 was responsible for most of the 106% increase in the red spruce tree truck cross-section area in the forests of West Virginia. The open-access paper is here. The authors produced records of tree truck area, leaf gas exchange and nitrogen of the region to investigate the multiple environmental effects on red spruce tree growth. CO2 fertilization caused the largest change in tree growth. The reduction is SO2 is the second largest contributor to the growth. Lower NOx levels had a negative effect and increasing temperatures increased tree growth. The authors wrote this study not only provides evidence for increasing CO2 having a positive effect on tree growth but also indicates a broad range of complexity as red spruce forest ecosystems recover from decades of acidic air pollution and the realization that none of the environmental factors that are examined here act in isolation." The effects of CO2, SO2, NOx, and April temperatures on red spruce tree growth over the 25 year period (1989 2014) were 59%, 38%, -21% and 14%, respectively.
The Climate Sciences Use Of The Urban Heat Island Effect Is Pathetic And Misleading
Government temperature indexes used in climate reports have a large urban warming component called the urban heat island effect. Geoffrey Sherrington wrote a review article on the urban heat island (UHI) effect in Australia. The failure to subtract the UHI effect resulted in the temperature trends to be too high. Phil Jones of the University of East Anglia selected 25 weather stations in Australia that he thought were free of the UHI effect. He subtracted the average temperature trends of those stations to those of 6 cities and concluded that the UHI was negligible. Warwick Hughes asserted that the 25 control stations have significant UHI so the analysis by Jones was misguided. The emails between Jones and Hughes led to the infamous and unscientific quote by Phil Jones Why should I make the data available to you, when your aim is to try and find something wrong with it.
In 1990, a paper by Australian Bureau of Meteorology found substantial urban warming, greater than the scale of global warming. Sherrington wrote Weather stations were designed and sited for purposes quite different to the demands now placed on them to correct for UHI. the signal:noise ratio of pristine ' sites is too small. A paper reports Urban areas are heavily overrepresented in the siting of temperature stations: less that 1% of the globe is urban but 27% of stations are located in cities with populations greater than 50,000. In Tokyo the excess warming is almost 2 °C/century compared to the rest of Japan. Tokyo can be up to 10 °C warming than its surroundings. Sherrington wrote Current large-scale numeric processing of country data to remove UHI effects are not based on solid science. Macquarie Island located SW of Australia is likely free of UHI effects. Its temperature trend over the last 50 years is 0.13 °C/century, just 8% of the HadCRUT4.6 trend of 1.63 °C/century. Sherrington wrote In conclusion, one has to admit that the present UHI correction procedures are junk science ' but with huge price tags attached for being wrong. He ends his article ends with a quote from the McKitrick & Michaels 2007 paper, Using the regression model to filter the extraneous, nonclimatic effects reduces the estimated 1980 2002 global average temperature trend over land by about half.
CliSci # 294 2018-12-14
Arctic Sea Ice Minimum Volume Is Increasing
The media and politicians often tell the public that the Arctic is rapidly melting. The annual minimum volumes of Arctic sea ice, which occurs in August or September, has generally been decreasing over the last 16 years, 2003 2018 at a best-fit trend of 86 billion m3/year. However, this declining trend in no longer happening. This article presents a bar chart of the minimum volume of Arctic sea ice with an increasing best-fit trend over the last 11 years, 2007 - 2018. The increasing trend is 60 billion m3 per year, which is equivalent to a 13% increase in ice volume over the 11-year period.
Climate Sensitivity to Cumulative Carbon Emissions
The last IPCC report Summary for Policy Makers (SPM) contains this graph which compares cumulative CO2 emissions to global average temperatures. It shows that as cumulative emissions increase, climate multi-model mean simulated temperature increase almost linearly. Climatologist Nic Lewis published a observationally-based estimate of this relationship. He showed that the AR5 temperature projections are too high by a factor of almost two in this century. Lewis calculate a transient climate response to emissions (TCRE) of 1.05 °C for 1000 GtC of CO2 emissions based on temperature and emissions data to 2016. However the multi-model mean value of TCRE is 2.0 °C. He calculates that 1000 years after emissions have stopped, the historical record suggest the actual temperatures would decline to only 0.5 °C, as CO2 is absorbed by the land and oceans. The models assume that the amount of CO2 that stays in the atmosphere is 1.9 times that of the estimate based on observations. The model-based chart in AR5 gives too high temperatures because the climate sensitivity to CO2 is far too high and the TCRE declines over time far faster than the models assume. The AR5 graph is even worse than that as Lewis assumes all the warming was due to human-produced greenhouse gases.
Special Report on Sea Level Rise
Dr. Judith Curry has spent 18 months reviewing the scientific literature on sea level rise (SLR) and wrote a report and a summary. She separates the alarmist speculations from the facts. The IPCC projects a 21st century SLR of 0.53 m from the two middle emission scenario, (RCP 4.5 and 6.0) with a likely range of 0.37 to 0.72 m. The other scenarios are near impossible. A forecast of 3 m due to the potential collapse of the West Antarctic Ice Sheet is considered barely possible. SLR began in the 1800s, long before humans could have had any effect. Curry concludes that the current rate of SLR in not unusual and sea levels were higher just 5000 years ago. The recent increase in SLR is due to the natural Atlantic Multidecadal Oscillation. The highest of local SLR is due to subsidence of land infilling of wetlands and ground water extraction.
Normalized Hurricane Damages in USA 1900 2017
A paper published in Nature Sustainability provided an updated calculation of the normalized hurricane damages as a proportion of economic activity from, 1900 to 2017. A normalization estimates direct economic losses from a historical extreme event if that same event was to occur under contemporary societal conditions. Over the period 1900 to 2017, there were 197 hurricanes making 206 landfall causing US$ 2 trillion in normalized 2018 damages, or about US$17 billion annually. The annual loss estimate shows no trend, consistent with the lack of trend in hurricane landfalls. The greatest annual normalized damage occurred in 1926 (US$244 billion), exceeding the next greatest loss year (2005) by about US$74 billion.
CO2 Concentration over the last 500 Million Years
A new study used estimates the atmospheric CO2 concentrations over the past 500 million years from a single proxy: the stable carbon isotopic fractionation associated with photosynthesis that increases as CO2 concentration increases. The data is from 306 marine sediments and oils. The study used a single proxy, which provides better consistency than other studies that used different proxies over various periods. The analysis used the fraction of isotope 13C to the total carbon content of the molecular fossil phytane which is derived from chlorophyll. See this graph of CO2 concentrations in micro-atmosphere (μatm). To convert to ppmv multiply the μatm by about 1.03. The CO2 concentration during most of the last 500 million year were higher than the current CO2 concentration of 405 ppm.
Excess Winter Deaths in England and Wales Highest Since 1976
The Guardian reported There were 50,100 excess deaths in England and Wales last winter, when there was a prolonged spell of extreme cold, making it the highest number since 1976, figures have shown. The 50,100 excess deaths were about 15,000 more than those that occurred in 2016-17 and double the total in 2015-16. Age UK 's charity director said Poor housing, high energy prices and ill-health can make winter a dangerous time for many older people
Dr. Nir Shaviv at a pre-COP24 Conference: Solar Forcing
Dr. Nir Shaviv was invited to a pre-COP24 conference to testify to the German Bundestag 's environment committee. Professor Shaviv was our guest speaker at the FOSS 12th annual major event in 2015. He presented a correlation of the rate of sea level rise and total solar irradiance, indicating that the sun has a major effect on climate. He finds that the sun contributed more than half of the 20th century warming. He said The fact that the temperature over the past 20 years has risen significantly less than IPCC models, should raise a red flag that something is wrong with the standard picture. He wrote that a model that includes significant solar forcing, one can get a much better fit to the 20th century warming, in which the climate sensitivity is much smaller [than estimated by the IPCC]. (Typically 1 °C per CO2 doubling compared with the IPCC's canonical range of 1.5 to 4.5 °C per CO2 doubling).
Methane Emissions From Livestock Have No Detectable Effect On The Climate
An article by Dr. Albrecht Glatzle published in Intech Open says We expose important methodological deficiencies in IPCC and FAO (Food Agriculture Organization) instructions and applications for the quantification of the manmade part of non-CO2-GHG emissions from agro-ecosystems. There is no clear domestic livestock fingerprint, neither in the geographical methane distribution nor in the historical evolution of mean atmospheric methane concentration. There is no scientific evidence, whatsoever, that domestic livestock could represent a risk for the Earth 's climate. Eight key point from the paper is summarized by Kenneth Richards.
CliSci # 293 2018-11-19
Chukchi Sea Polar Bears Number about 3000
A new survey in the Chukchi Sea region shared by Russia and Alaska estimates the polar bear population at about 3000, making it the largest subpopulation in the Arctic. Polar bear specialists previously used a guesstimate of about 2000. The study by researchers at the University of Washington and federal agencies was published in Scientific Reports. The study showed polar bears have similar amounts of body fat as 25 years ago. Research has been ongoing in the region since 2008. Dr. Susan Crockford wrote on her blog Now it 's all coming together to paint a picture of a large population of polar bears in excellent physical condition, with strong reproduction and cub survival (such as triplet litters sighted on numerous occasions), despite a much longer ice-free period in summer than in the 1980s.
See related story in FoS Extracts Too Many Polar Bears .
Fingerprints of Internal Drivers of Arctic Sea Ice Loss
A paper published in Nature GeoScience shows that low-frequency atmospheric oscillations can cause substantial summer sea ice melting. This internal variability is estimated to have caused 40 to 50% of the observed decline in summer sea ice since 1979. This implies that black carbon aerosols and greenhouse gases may have caused only 50 to 60% of the sea ice decline. The authors used a fingerprint pattern match method to estimate the internal variability by comparing observations to climate models. They say the climate models have trouble replicating an observed linkage between the Arctic and lower latitudes in recent decades.
Ocean Heat Uptake Paper Grossly Over-estimated Warming
A paper, Resplandy et al (2018) published in Nature that claimed the oceans were gaining heat much faster than previously estimated received a great deal of media coverage. The estimated heat gain of the oceans was based on measuring the changes in the ratio of oxygen to nitrogen, and CO2 concentrations in the atmosphere. Climate scientist Nic Lewis wrote a series of three blog posts that revealed serious errors in the paper. The trend of the ocean heat content (OHC) was overstated and its uncertainty greatly understated. An uncertainty-weighted least square calculation was used to estimate the change rate of the OHC. The authors set the uncertainty to zero in 1991 by assumption which biases the slope upward. Lewis shows that applying the corrections make the OHC trend estimate change from 1.33 ± 0.20 to 1.03 ± 0.82 x 10²² J/yr. This is a 23% reduction of the OHC trend and a quadrupling of the estimated uncertainty. The second author R. Keeling has acknowledged some errors and they plan to issue a correction to the journal. However, they have also changed the value of a land oxidative ratio that increases the trend, and failed to correct an uncertainty related to fossil fuel burning. Lewis says I believe that they will need to revise their correction accordingly. We have a global array of 3959 temperature/salinity profiling floats, known as Argo, for measuring changes in ocean heat content. This gives a muchmore accurate estimate of the OHC than an estimate from O2/N2 ratios in the air.
Admitting Mistakes in a Hostile Environment '
Judith Curry wrote an insightful blog post concerning the reaction to Nic Lewis ' critique of the Resplandy et al (2018) paper on ocean heat content (above). She wrote Ralph Keeling behaved with honesty and dignity by publicly admitting these errors and thanking Nic Lewis. Galvin Schmidt wrote that the authors did a careful reexamination of their working despite a somewhat hostile environment. Curry asked Exactly what is hostile ' about an independent scientist auditing a published paper, politely contacting the authors for a response and then posting the critique on a blog? Schmidt previously wrote hostile blog posts in response to Lewis ' critique of the Marvel et al paper. Curry wrote This blog post by Gavin provides a sense of the hostile environment ' faced by independent scientists who evaluate climate science papers. Scientists should welcome discussion of their research and being pointed to any errors. She remarked that McIntyre and McKitrick faced a very hostile environment when they published their critique of the Michael Mann hockey stick graph.
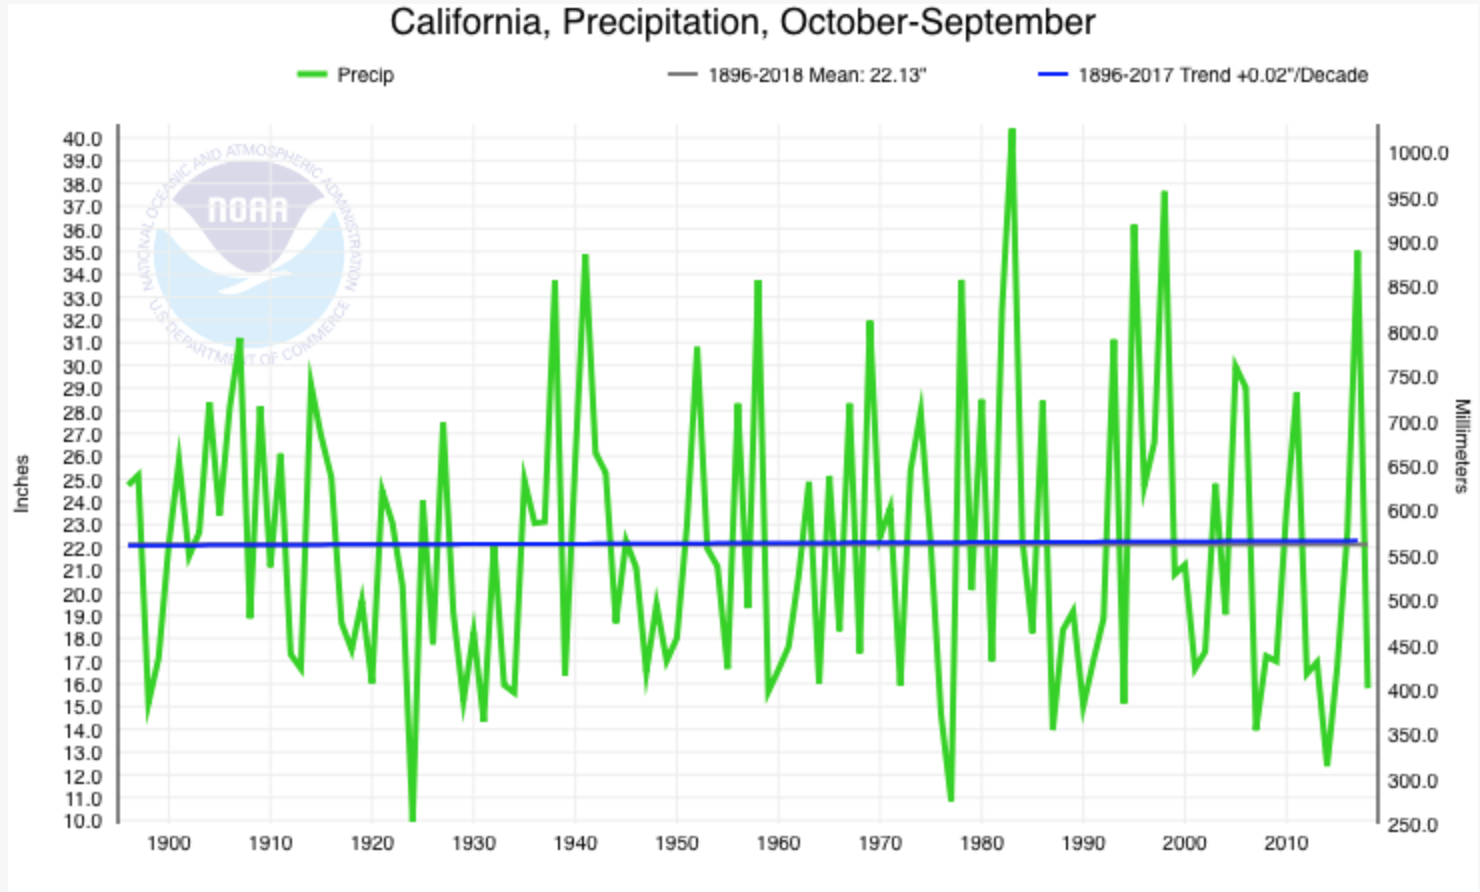
California Wildfires: Cause by Climate or Forest Mismanagement?
Recent wildfires in California have caused a tragic loss of life and property. The blame game is now if full swing. Governor Jerry Brown insists Dryness, warmth, drought, all those things are going to intensify, because of climate change. US President Trump tweeted that the recent fires and lives lost are because of gross mismanagement of the forests. A graph here of California precipitation 1896-2017 shows no trend. Rainfall in this summer spurred new plant growth, followed by warm winds that dried the foliage. An article by Paul Driessen reviews the fire debate. He wrote The problem isn 't climate change. It 's ideological, even criminally incompetent forest management practices demanded by politicians, regulators, judges and environmentalists in recent decades. He wrote Tree thinning has been banned, resulting in thousands of skinny, fire-susceptible trees growing where only a few hundred should be present. Even removing diseased, dead and burned trees has been prohibited. This article from Inconvenient Blog ' shows that the number of California fires have been declining since 1970, while the area burned has increased slightly. More homes have been built in fire prone area. The dense growth near homes can lead to fire infernos.
CliSci # 292 2018-11-06
The Economics of the IPCC 's Special Report (SR15) on Limiting Temperatures to 1.5 °C
The Intergovernmental Panel on Climate Change published a special report (SR15) on the impacts of global warming of 1.5 °C above pre-industrial levels on October 8, 2018. The report says the cost of mitigating CO2 emissions in 2030 to meet the 1.5 °C target is about 880 US$/tCO2. The benefit of doing so, according to the report, is 15 $/tCO2, which is the social cost of CO2 using the climate models ' distribution of climate sensitivity and the DICE economic model. That model does not include significant benefits from CO2 fertilization or warming and exaggerates damages by failing to include adaptation. Using a climate sensitivity based on observations including effects of natural climate change, urban warming and the best available economic model, the FUND model, the mitigation proposal will prevent a benefit of 8 $/tCO2, for a total loss of 888 $/tCO2 mitigated. See my analysis here.
Remarkable Changes to CO2 Emission Budgets in the IPCC SR15 Report
Climatologist Nic Lewis compared the carbon budget for meeting a 1.5 °C target above pre-industrial temperatures (estimated as the average of 1850 to 1900 temperatures) according to climate models between the AR5 report of 4 years ago and the recent SR15 report. The carbon budget is the remaining amount of cumulative CO2 emissions that can be emitted into the atmosphere such that the greenhouse gas induced temperature change would not exceed the 1.5 °C target. The projected temperature change is determined in the report from the transient climate response to cumulative emissions (TCRE) from climate models. Lewis writes So, the remaining carbon budget from 1 January 2011 for a 66% probability of keeping below 1.5 °C has been increased by 460 GtCO2, from 400 to 860 GtCO2 more than doubled. Deducting the estimated 290 GtCO2 emissions during the 2011 to 2017 period, the change from 1 January 2018 is from 110 GtCO2 to 570 GtCO2 over five times as high. The carbon budget increased for four reasons; the forecast warming to 2010 used in AR5 was greater than the model mean, the measure of ocean warming up to 2010 was changed from air to sea surface temperatures which reduced the warming in SR15, the AR5 report overestimated climate model warming by using a subset of models that had higher TCRE than the average of all the models, and the SR15 warming from non-CO2 emissions is less than in AR5.
A Global Assessment of Atoll Island Changes Over the Past Decades
An analysis of available imagery of 30 Pacific and Indian Ocean atolls including 709 island found that no atoll lost land area and that 88.6% of islands were either stable or increased in area, while only 11.4% contracted despite sea level rise. Atoll islands at locations of rapid sea level rise did not show a distinct behavior compared to other atoll islands. No island larger than 10 ha decreased in size. The corals associated with atoll islands continually provide material to the islands so they grow to keep pace with sea level rise. Atoll islands are not at significant risk from sea level rise.
Climate Models Underestimate the Carbon-Climate Feedbacks
Earth System Climate models (ESM) poorly represent nutrient dynamics that is critical in forecasting the carbon cycle. A new study of the effects of observed plant nutrient uptake mechanisms shows that current ESMs have large biases of nitrogen leaching and N2O emissions, which is a significant greenhouse gas. The study found that the night-time nitrogen uptake leads to positive 44% biases of N2O emissions in the climate models. The large bias of N2O emissions results in lower CO2 sequestration capacity. Both factors imply that the carbon-climate feedback is too high in the current ESM 's and that they are overly sensitive to greenhouse gas emissions.
Gulf Stream Variability and Multidecadal Atlantic Climate Variability
This study used several dataset to analyze the causes of the Atlantic climate variability. The summary says The North Atlantic Ocean is a region of remarkable variability in surface temperatures on timescales of decades and longer. Much debate surrounds whether this variability is driven by the atmosphere or by ocean currents, such as the Gulf Stream, moving heat around. The study shows that on timescales around 10 years, the atmosphere is the likely cause of Atlantic temperature variability but that this changes when multidecadal variability is considered. Changes ongoing in the Gulf Stream coincide with changes in the broader Atlantic that imply a relatively cooler Atlantic in the coming decades. The abstract says Recent changes in the Gulf Stream Extension show a weakening and broadening of the current, consistent with increased instability.
Solar Forcing and Climate Variability During the Past Millennium
A study of lake sediments in Anatolia (Turkey)presents a climate records over the last 1400 years. The lake sediment cores ' multiproxy results revealed lake water level fluctuations associated with humid and dry spells. The lake level vary with total solar irradiance. The abstract says Moreover, the Lake Salda records clearly show dry Dark Ages Cold Period (DACP), humid Medieval Climatic Anomaly (MCA), dry Little Ice Age (LIA), and humid Modern Warm Period (MoWP). These records suggest that the solar forcing, through its influence on the atmospheric circulation, is the main mechanism of climate change during the DACP, MCA, LIA and MoWP in this region.
Abominable Inadequacy Of Europe 's Wind Energy
A German wind energy opposition organization posted charts showing the extreme variability and inadequacy of wind energy for 15 European countries as shown in this blog post. The charts show that wind power generation collapses in minutes. Adding wind capacity does not reduce the extreme variability. As more capacity is added the power peaks become higher and the instability becomes far more extreme. The wind turbines produce only an average 15% of their rated power capacity. Wind power can almost disappear only hours after producing at 40% capacity. In June 2018, wind turbines in Germany produce 0 to 10% of their capacity for 43% on the month, and produce more than 30% of their capacity for only 6.7% of the month.
CliSci # 291 2018-10-13
Florida Major Hurricane Strikes: Still No Trend
Hurricane Michael made landfall in the USA on October 10 near Mexico Beach, Florida as a category 4 hurricane causing extensive property damage. As of October 12 there were 16 confirmed deaths in the USA attributable to the hurricane. Dr. Roy Spencer produced a plot of Florida major hurricane wind speed at landfall since 1900, including Hurricane Michaels. It shows that there is no significant trend in wind speed. He reports that the summer sea surface temperature over the eastern Gulf of Mexico was only the 9th warmest since 1860. Of the top 10 warmest years, 7 occurred before 1970, which is before the region experienced any significant warming. Some experts make vague claims that we can expect more major hurricanes in a warming world, but Spencer says the data do not support the theory.
7,000 Year History of Florida Gulf Coast Hurricanes
A study of lake bottom sediments in the Florida panhandle gives a 7000 year record of catastrophic Gulf coast hurricane landfalls, category 4 or 5. The study shows an hyperactive period from 1000 to 3400 years ago and two relatively quiet periods, 3400 to 3400 years ago and the last 1000 years.
An Audit of the HadCRUT4 Global Surface Temperature Data
An audit report by Dr. John McLean of the HadCRUT4 temperature dataset finds more than 70 issues that make the dataset unfit for climate studies. The HadCRUT4 dataset is produced in the United Kingdom dataset from ocean and land temperature data. It is the main temperature dataset used by the IPCC. The audit found incorrect adjustments, obviously bad data, scarsity of data and significant but questionable assumptions. More than a quarter of the land stations don 't meet the stated criteria for inclusion.
Stations are often moved when development gets too close. All the data from the original location is adjusted down by the same amount, which is a very wrong. It assumes the site was always heated the same by development so it makes the earlier data cooler than it should be. Data errors include Fahrenheit temperatures reported as Celsius and location errors. One town had average temperatures for three months of 1978 of over 80 °C . Land temperatures for the Southern Hemisphere in 1850 and 1851 were calculated from one site in Indonesia, and by the end of 1854 just 3 stations reported data. 50% global coverage wasn 't reached until 1906. The author writes The primary conclusion of the audit is however that the dataset shows exaggerated warming and that global averages are far less certain than have been claimed. The Executive Summary and other information is here.
Climate Audit of PAGES 2K
Steve McIntyre of Climate Audit reviews the South American portion of the latest version of PAGES 2K, a collection of temperature proxies, including tree ring data and lake sediment data. PAGES 2K (Past Global changES 2000 years) is used by the IPCC to suggest that recent warming is unprecedented. Tree grow faster in warmer climates, but are more affected by other factors, including precipitation, shade and CO2. Tree ring series were selected from larger collections of series base on how well they match the instrument temperature record. This selects series that show a hockey-stick shape purely by chance. Only 4 out of a group of 63 tree ring series were selected. McIntyre writes I do not believe for a minute that these four tree ring chronologies are unique thermometers. A lake sediment series shows the rate of modern accumulation is more than ten(!) times greater than the rate of accumulation in the previous 15 centuries. McIntyre shows that this is clearly caused by the construction of a dam at the lake outflow rather than an increase in temperature. He says, All in all, a rather pathetic show by PAGES2K.
The role of Solar Cycles and Volcanoes on Recent Climate Change Underestimated
A paper published in Frontiers of Earth Science examined the role that solar cycles and explosive volcanoes played in the recent warming 1976 to 1996, the global warming hiatus ' period after 1998 and other periods. The author says that the Sun and volcanoes play important roles in the recent climate change. The warming period 1976-1996 included two major volcanoes in 1982 and 1991, and two strong solar cycles. Paleoclimate records show nearly twice the probability of an El Ni ±o occurrence in the winter following a volcanic eruption. Previous modeling studies also suggest that explosive volcanic eruptions lengthen El Ni ±o and shorten La Ni ±a (cold) periods. However, models fail to capture the Northern Hemisphere dynamical response. This study suggests that explosive volcanoes change the sea level pressures in the North Atlantic, and through several processes leads to more persistent and frequent El Ni ±os.
CliSci # 290 2018-09-25
Future Response of Global Coastal Wetlands to Sea-level Rise
A paper published in Nature reports the current global-scale projections of coastal wetland loss due to sea-level rise (SLR) during the 21st century do not take into account of the ability the wetlands to build up vertically by sediment accretion. The authors present an modeling approach that considers sediment accretion and the available space for wetlands to grow. The simulations show that wetland gains of up to 60% of the current area are possible, assuming that 37% of coastal wetlands have sufficient accommodation space. Large loss of coastal wetland could be avoided by adaptation solutions to coastal management. As sea levels rise, storms and high tides move sediment inland to be colonized by wetland vegetation. The paper suggests that nature-based adaptation solutions that maximize the inland migration of tidal wetlands in response to SLR, wherever possible, may help safeguard wetland persistence with SLR and protect associated ecosystem services.
A Test of the Tropical 200-300 mb Warming Rate in Climate Models
A paper by Dr. Ross McKitrick and Dr. John Christy published in Earth and Space Science tests a major component of climate models, being the warming of the tropical mid-troposphere at 9 to 12 km altitude, and finds that the models used in the last IPCC report show a large, statistically significant warming bias. The authors show that a failure of the models to reproduce the actual warming of the tropical mid-troposphere falsifies the models. Actual temperature measurements of 1958-2017 from three weather balloon datasets were compared to all 102 model runs. Trends and confidence intervals were generated for a simple trend and one with a break at 1997 corresponding to the Pacific climate shift. The trend is 0.33 °C/decade in the models and 0.17 °C/decade in the observations. With a break term included they are, respectively, 0.39 °C/decade (models) and 0.14 °C/decade (observed). The mid-tropospheric warming trends in the models are caused by increasing water vapour in response to rising CO2 levels due to flawed moist convection thermodynamic parameterization. Correcting the parameterization to match the temperature and water vapour amounts would greatly reduce the model 's climate sensitivities by reducing the water vapour feedback. McKitrick wrote a description of the paper at the Climate Etc blog. Robert Lyman wrote a summary on the FoS blog.
Global Greening by Vegetation Type Over the Last 17 Years
A paper published in Remote Sensing uses a new technique to monitor leaf area by satellite by nine vegetation types over the last 17 years (1999 2015). The Leaf Area Index (LAI) is the area of green leaves per unit area of the ground, and can be much greater than 1.0 with overlapping leaves. Satellite data was verified by ground observations. Greening trends are significant in six vegetation types. Coniferous forests have an average LAI of 2.30 and have greened the most at 0.042 yr-1 with a growth rate of about 18% per decade. Summer crops have the 2nd highest greening trend of 0.039 yr-1. Dr. Pat Michael discusses the paper in this blog post. Grasslands are the most common vegetation type covering 31% of the continents excluding Antarctica. Its average LAI is 0.55 and is growing at 51% per decade. A previous study by Zhu et al suggests that the CO2 fertilization explains 70%, and warming explains 8% of the global greening.
Arctic Sea Ice Minimum
Arctic sea ice extent and volume are now growing. See the Friends of Science Polar Region sea ice page which gives links to many real time graphs from satellite data. The minimum sea ice extent this year was 4.553 million km2 which occurred on September 16 according to NOAA data (csv file). This minimum was very close to last year 's minimum and is the 5th lowest of the satellite era. The annual minimum extent trend is actually positive from 2010. The minimum sea ice volume was the same as the average years 2004-2013 and significantly greater than in 2015, 2016 and 2017. Scientist presented a paper at the AGU 2007 fall meeting that indicate northern polar waters could be ice-free in summers within just 5-6 years , or by 2012-2013, a very bad modeling prediction.
Historical Black Carbon Deposition in the Canadian High Arctic
A paper published in Atmospheric Chemistry and Physics presented a 250-year ice core record of black carbon disposition from Devon Island in the Canadian high Arctic. It is the first such record from the region. The estimated average black carbon disposition rate for 1963-1990 is 0.2 mg/m2 per year. In contrast, the estimated black carbon disposition rate from Greenland ice cores range from 0.1 to 4 mg/m2 per year. In the Devon ice core there is only a modest increase in black carbon (BC) during the 20th century, while in Greenland there was a pronounced rise from 1880 to the 1910s attributed to the coal burning emissions. The study suggests there is large variability of BC aerosol deposition across the Arctic region arising from different transport patterns. Black carbon lowers the albedo of Arctic snow and ice.
Atmospheric Carbon Dioxide and Global Temperature for the Last 425 Million Years
A paper published in the journal Climate explores the relationship between CO2 concentrations and global temperatures over the last 425 million years using stable-isotope proxies and the radiation code MODTRAN. The paper was reviewed by CO2 Science. The research utilized 6680 proxy temperature and 831 proxy CO2 measurement. The abstract says Atmospheric CO2 concentration is correlated weakly but negatively with linearly-detrended T [temperature] proxies over the last 425 million years. Only 2.6% of the variance in temperature is attributable to variance in the CO2 radiative forcing. The author says there is an "apparent dissociation and even an antiphasic relationship" among the two variables. h/t Henri Masson
UK Residents ten times more likely die due to cold home than a traffic accident '
The principal author of a report by the UK 's National Energy Action says In England alone, between 1 January and 31 March 2018, an additional 15,544 deaths occurred. The death were due to a cold spell that the media dubbed the Beast from the East '. People were almost ten times more likely to die from a cold home than a road traffic accident. And even though other winters have been much milder, there are still approximately 9,700 premature deaths a year due to vulnerable people being unable to heat their homes adequately, if at all. Domestic electricity prices in the UK have increased from 2003 to 2015 by 230% (55 to 128 price index) primarily due to increasing wind and solar capacity.
CliSci # 289 2018-09-14
End of the Little Ice Age in the Alps Forced by Black Carbon
Black carbon (or soot) has been a significant driver of climate change as shown by several studies. The Intergovernmental Panel on Climate Change 's (IPCC) obsession with carbon dioxide caused it to misallocate warming from black carbon to warming by CO2. Glaciers in the Alps began to retreat in the mid-19th century, which is considered the end on the Little Ice Age. A paper published last year shows that glaciers should have continued to grow to 1910 based on temperature and precipitation records, but they began to retreat at least 60 years earlier due to black carbon falling on the ice which increases solar energy absorption. Ice cores indicate that black carbon concentrations increased abruptly in the mid-19th century and largely continued to increase into the 20th century, consistent with known increases in black carbon emissions from the industrialization of Western Europe. The spring melt season black carbon forcing was 35 W/m2 by 1910, which was 62 times that of the total greenhouse gas forcing by then of 0.56 W/m2.
Beyond Milankovitch: Termination of Ice Ages and Interglacials
An article by Donald Rapp reviews the science of the termination of ice ages over the last 800,000 years with emphasis on a paper by Ellis and Palmer (2016). The paper explains how declining CO2 levels during an ice age causes plants to die in high plains (mainly the Gobi plateau), resulting in widespread desertification and soil erosion. The resulting dust storms depositlarge amounts of dust upon the ice sheets, allowing a much greater absorption of solar energy and ice melt, but only during a Great Summer of high solar insolation due to the 22,000 year precessional cycle. The great northern ice sheets melt during the transition to the interglacial. The CO2 levels rise during the interglacial to about 280 ppm, plant life flourishes and dust levels drop. The clean remaining show and ice in the north then reflects solar energy so the ice sheets expand and a new ice age begins. The paper and Rapp 's calculations fully explains the glacial to interglacial cycle over the last 800,000 years.
I also found Ralf Ellis ' comment here interesting. He writes the Royal Society declared the Dust-Albedo paper to be a Denier Paper the Royal Society was inhabited by imbeciles. One of the paper 's reviewers said that plants at high altitude could not be starved of CO2, because the concentration of CO2 at altitude is the same as at sea level. I did ask in return why airliners have emergency oxygen for passengers, since the concentration of O2 at altitude is the same as at sea level !
Climate Alarmists Falsely Blame Hurricane Florence on Climate Change
I have been monitoring Hurricane Florence as it approaches the Carolinas. It was predicted to be a major hurricane but it was only a category 1 hurricane at landfall and was quickly downgraded to a tropical storm at 5 pm EDT on Friday. Many news reporters and alarmist scientists have tried to link the storm to climate change. Writing for NBC News, Kristina Dahl contended, With each new storm, we are forced to question whether this is our new, climate change-fueled reality. Dr. Roy Spencer wrote an article published in US Today where he explained that Hurricane Florence is not the result of global warming. It's just the weather. His blog shows that the 36 most costly hurricanes in U.S. history show a decline in intensity over time.
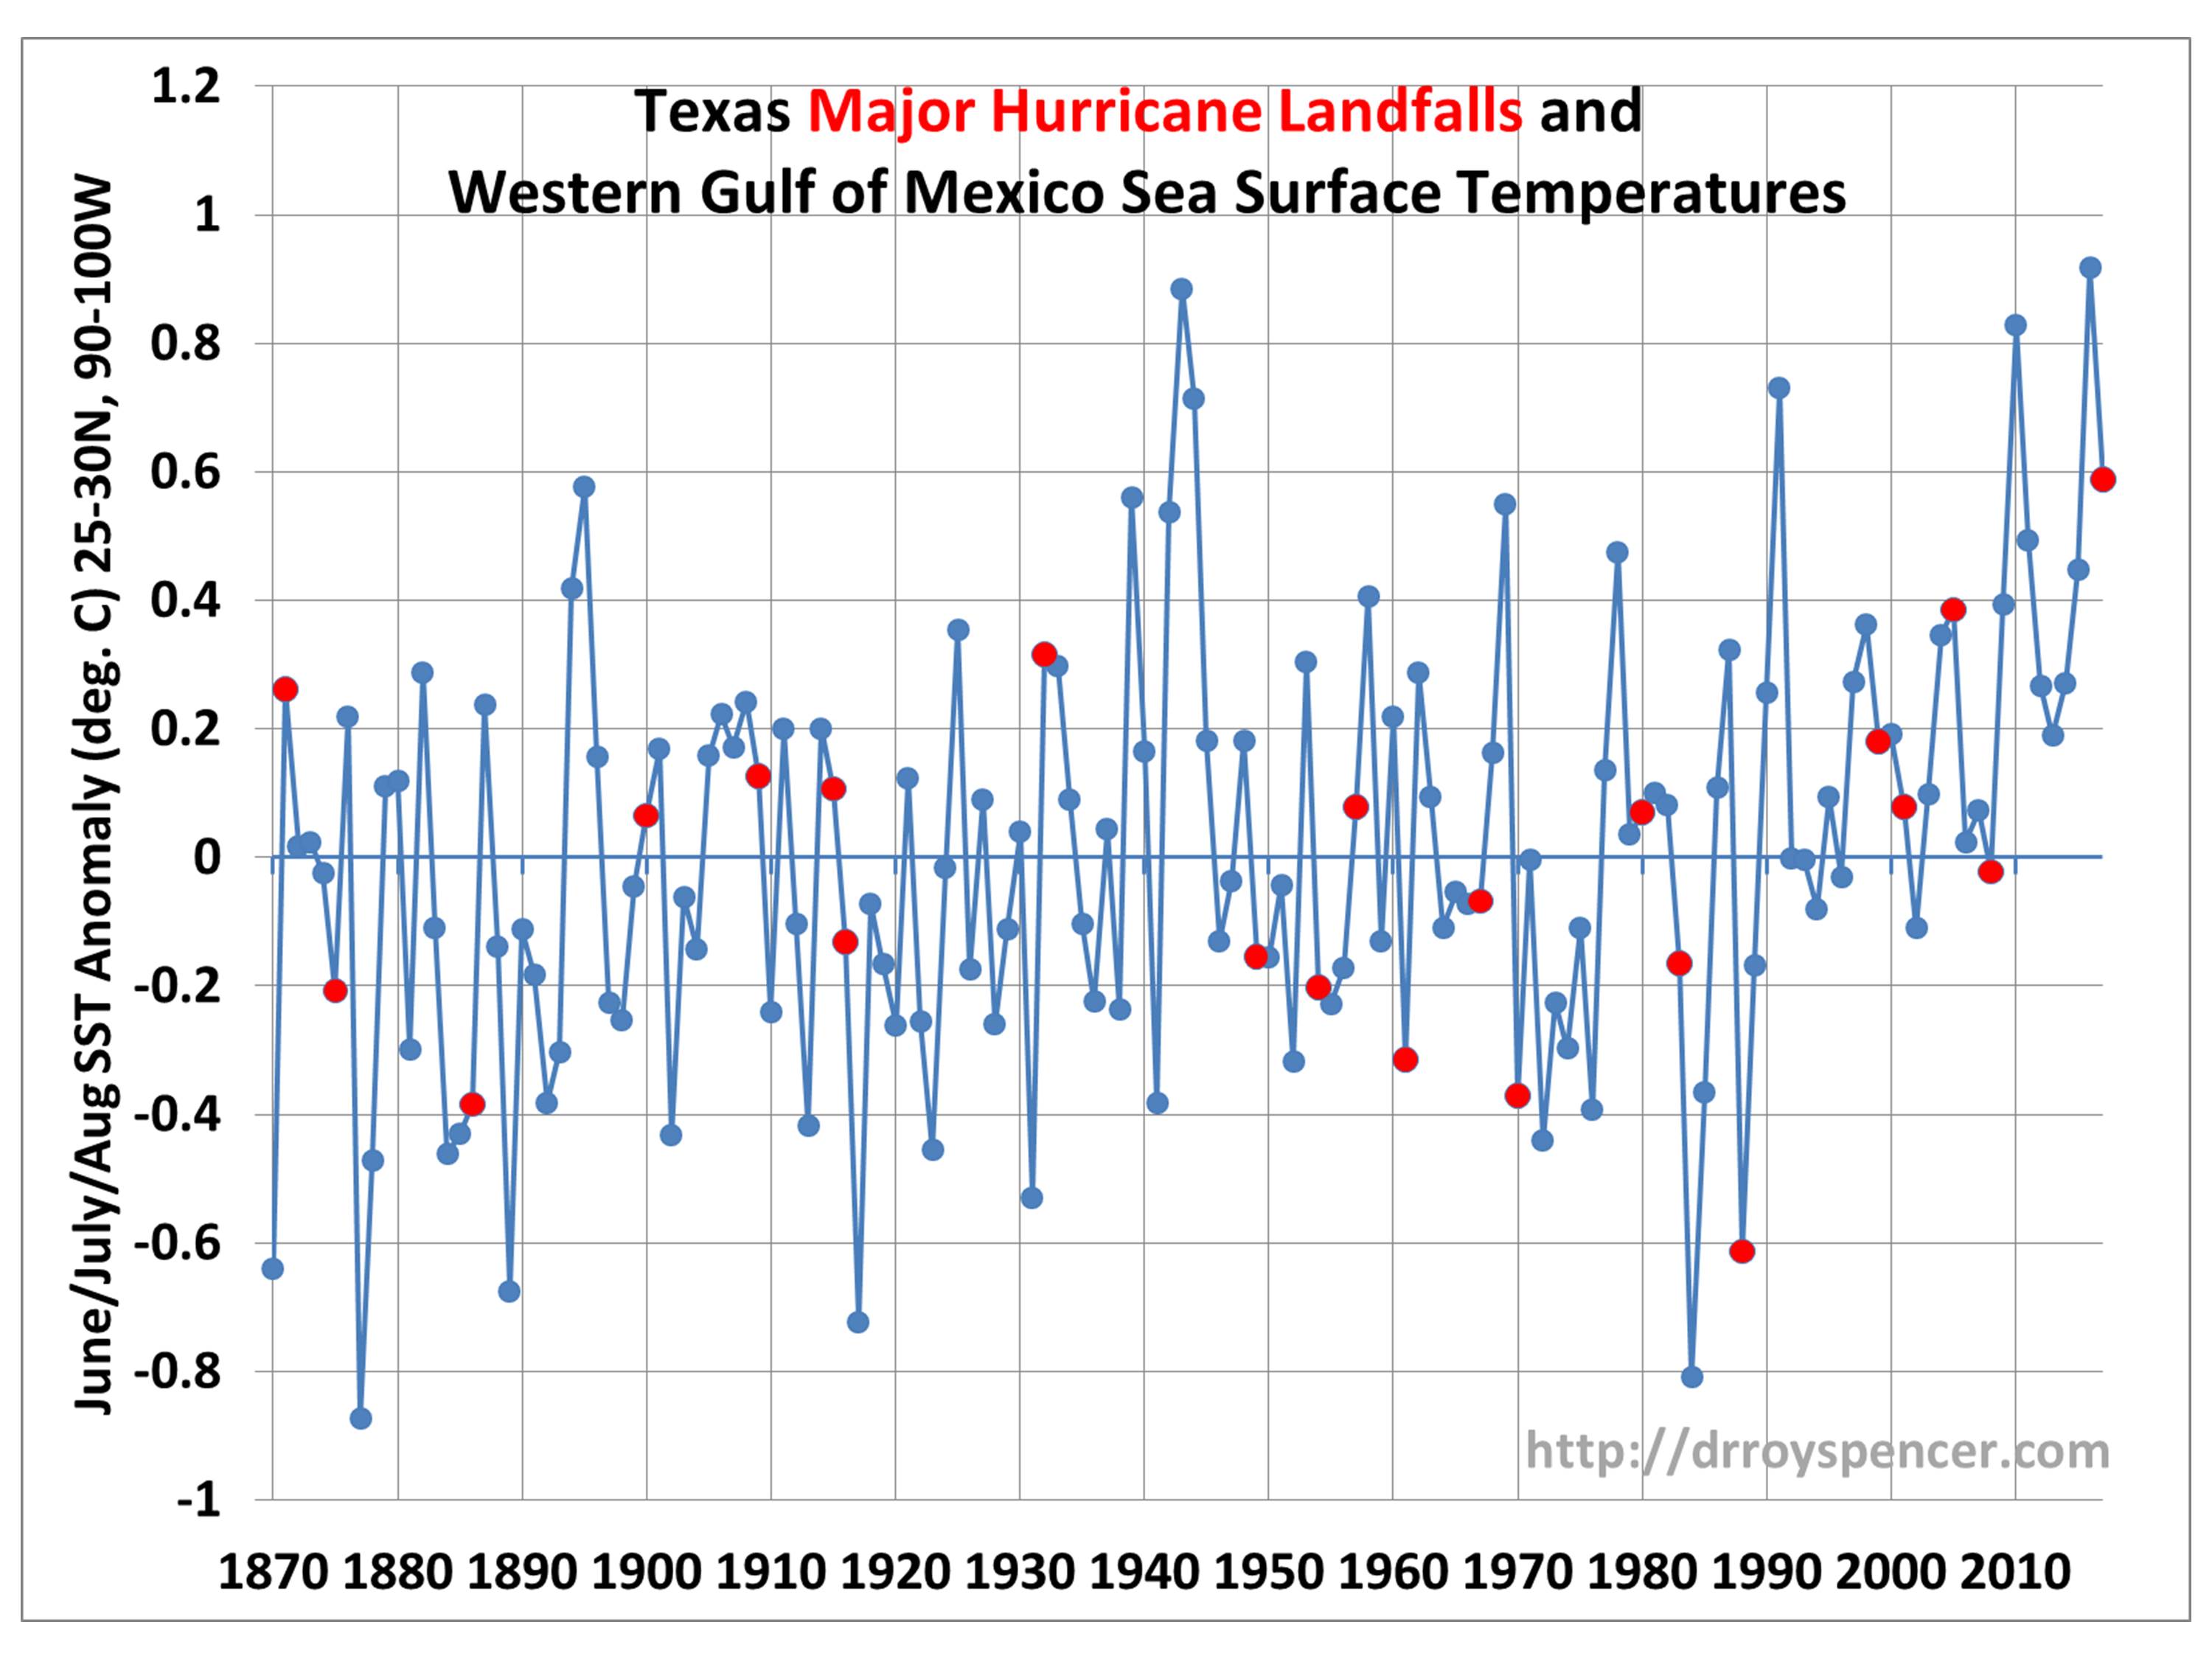
Number of Hurricanes are Unrelated to Sea Surface Temperatures
There is no correlation between the number of hurricanes and sea surface temperature (SST). Red dots on this graph indicate years of major hurricane strikes in Texas, 1870 to 2017, plotted against average summer SST departures from normal by year over the western Gulf of Mexico, see here. There are 11 hurricanes above normal and 11 below normal SST. That is because hurricane strength depends on the difference between the SST and the cloud top, along with other factors, like the lack of wind shear. With global warming, both the temperatures at the sea surface and at the cloud tops increase at the same rate, so there is no trend in the temperature difference that powers hurricanes as shown in my FoS graph. The graph shows no trends in the temperature difference between the surface and at 8.3 km or 11.5 km altitude, so there is no change to power stronger storms. However, hurricanes do increase in intensity when they move over warmer sea regions because SSTs vary considerably across the map but the cloud top temperatures do not. The same behavior would be expected if the global temperature increased.
Continental U.S. Hurricane Landfall Frequency Declines
A paper by Dr. Philip Klotzbach published this year shows that the frequency of all (category 1-5) and strong (category 3-5) US landfalling hurricanes have declined during 1900 to 2017. The abstract says Continental United States (CONUS) hurricane-related inflation-adjusted damage has increased significantly since 1900. However, since 1900 neither observed CONUS landfalling hurricane frequency nor intensity shows significant trends, including the devastating 2017 season. See a discussion by Pierre Gosselin and graphs from the paper. There was an unprecedented 12-year long period from 2005 to 2017 which saw not a single major hurricane hitting the US.
Reconstructing 800 Years of Summer Temperatures in Scotland
A paper published in Climate Dynamics presents a 810-year temperature reconstruction in Scotland to improve estimates of past climate variability.The abstract reads, This study presents a summer temperature reconstruction using Scots pine tree-ring chronologies for Scotland allowing the placement of current regional temperature changes in a longer-term context. Living-tree ' chronologies were extended using subfossil ' samples extracted from nearshore lake sediments resulting in a composite chronology >800 years in length. CO2 Science reviewed the paper and provided a graph of the reconstruction. In placing the most recent warming of the instrumental period in context, Rydval et al. write that it "is likely not unique when compared to multi-decadal warm periods observed in the 1300s, 1500s and 1730s." That means according to the review there is nothing unusual, unnatural or unprecedented about the current warmth of Scotland.
CliSci # 288 2018-08-25
Emergent Constraint on Equilibrium Climate Sensitivity
A paper published in Nature earlier this year concluded that the central estimate of equilibrium climate sensitivity (ECS) is 2.8 °C, which is just a bit less than the climate model average of 3.2 °C. ECS is the global average temperature increase in response to a doubling of CO2 after allowing the oceans to reach equilibrium (about 2500 years according to models). The authors constrained climate models by their ability to simulate recent observed variations in climate. They conclude that the probability of ECS being greater than 4.5 °C is less than 1%. In contrast, the IPCC (AR5 chapter 12) shows that there is a 17% chance that ECS is greater than 4.5 °C. As this is based on models, this assumes strong positive feedbacks, no natural climate change and no urban warming effects, all of which are incorrect. So why mention this? See next article
Trajectories of the Earth System in the Anthropocene
A perspective article published in PNSA gives a worst case scenario where the earth might transition to a hot-house state. The paper is perfect for the Main Stream Media and the scientist authors as it is likely to result in higher newspaper sales and higher climate research funding. The paper assumes the earth oscillates between ice age and interglacial periods without cause. There is no mention of sun or solar in the paper except that we may have to do solar radiation management to avoid a hot-house state. In fact, we know the ice ages are cause by solar radiation changes and the warming from the last great winter is in part due to low CO2 levels. The paper is not a research paper and it presents no new climate science. It does use climate models. Some climate model runs project a temperature increase corresponding to a climate sensitivity of as high 9 °C. Model runs with CS over 4.5 °C should have been excluded as those CS are extremely unlikely as per the previous article.
Harmonic Analysis of Worldwide Temperature Proxies for 2000 Years
This open access paper published in the journal The Open Atmospheric Science Journal last year shows that the strongest cyclic global temperature components are the ~1000-, ~460-, and ~190-year periods. These cycles are also dominant in the production of solar-induced cosmogenic nuclides 14C and 10Be. The ~190-year period, known as the De Vries/Suess cycle in the most dominant is the solar data. The authors say the analysis proves that at least the ~190-year climate cycle has a solar origin. The DeVries/Suess cycle in climate is the Gleissberg cycle in the solar radiation. The authors used Fourier spectrum wavelet analysis. The paper says, Records of the cosmic isotopes 14C and 10Be found in tree rings and ice cores confirm that the magnetic field of the Sun had varied over distinct cycles in the past and we have confirmed the solar origin of the most prominent ~190 year cycle over 10,000 years with new accuracy. Temperature records include instrumental HADCRUT4, RSS satellite data and six paleo-temperature reconstructions, which utilized tree-rings, ice-cores, speleotherms and others.
Wind and Solar Costs 9 times that of Other Electricity Sources in Europe
The average of wind and solar electricity prices in Europe in 2014 were 8.9 times that of what the average electricity price from other sources, mainly fossil fuels, would have been without any wind and solar capacity. This chart of electricity prices in Europe versus installed solar and wind energy capacity per person was created by this Excel file. The extreme variability of wind and solar power imposed very large costs on other forms of electricity that must be dispatched to offset that variability. This calculation by me is based on electricity prices in 2014 reported by Eurostat and Germany 's wind and solar capacity reported by Strom-report.
Interim Review of The Cold Sun Theory
Fritz Vahrenholt and Sebastian L ¼ning have published an interim review of what has happened compared to their theories since their book The Cold Sun was published in 2012. See the Google translation from German. To summarize only 3 of 7 items, they say;
- The book reviews a large number of studies that found a significant impact of the sun on the climate. A large number of other studies published since the book was published have also found strong solar influences on the climate, which climate modeler ignore.
- Ocean cycles are now recognized climate factors by climate scientists which climate modelers continue to ignore and dismiss as random noise.
- The book criticized climate modelers for using aerosols as a huge fudge factor to offset much of their exaggerated CO2 warming effect. It is now known that the aerosol cooling effect is small, so the CO2 warming effect is also small.
Scientist Calls Out Media Misinformation ' On Wildfires And Global Warming
Some scientists, such as Michael Mann, and environmental advocacy groups have been spreading misinformation about wildfires in California, falsely claiming that they are caused primarily by man-made climate change. University of Washington climate scientist Cliff Mass says that this is not true because the number of fires has declined during the past decades and the California state figures show a decrease in area burned in four out of five regions. Land management and population growth are major factors for wildfire since most fires are started by humans. U.S. Geological Survey fire scientist Jon Keeley says What 's changing is not the fires themselves but the fact that we have more and more people at risk.
Lower land-use Emissions Responsible for Increased Land Carbon Sinks
Roughly half of fossil fuel and industrial emissions of carbon dioxide (CO2) are absorbed by so-called carbon sinks. Roughly half of the CO2 absorption is in the oceans and half in the land. Climate models project that these CO2 sinks will become more saturated, effectively offsetting the logarithmic decrease in the CO2 radiative forcing as its concentration increases. A paper published in Nature Geoscience confirms that land carbon sink has increased by a factor of three from 1980-1998 to 1998-2012, which is contrary to the models. The paper 's abstract claims that this can 't be explained by CO2 fertilization (greening of the earth) or climate change. The authors say that the dominant cause of the change is the decreasing land-use emissions, which is due to both decreased tropical forest area loss and increased afforestation in northern in the northern temperate regions. But note the contradiction; the increase of the amount of northern forests is due to both the CO2 fertilization affect and the warmer climate.
CliSci # 287 2018-07-21
The Greenhouse Effect with Increasing CO2 Is Cooling Antarctica
A research paper by the Helmholtz Centre for Polar and Marine Research in Germany presents a radiative analysis of the greenhouse effect over central Antarctica using measurements and models to shows that the greenhouse effect of CO2 is around zero or even negative in central Antarctica. An increase in CO2 concentration leads to an increased long-wave energy loss to space over central Antarctica, which cools the earth-atmosphere system. Increasing CO2 causes some warming only in the portion of the atmosphere (the troposphere) where temperatures decline with altitude so that the radiative emissions from CO2 at higher altitudes are less than at lower altitudes. But the average altitude of the ice surface of Antarctica (over land) is 2126 m, and the ice surface in East Antarctica reaches 4082 m, which puts it above the troposphere. There in the stratosphere, temperatures increase with altitude, so CO2 at higher altitudes emit more radiation, which can escape to space without being re-absorbed, than CO2 nearer the ice surface due to its lower temperature. The temperature trend at the South Pole from 1957 2013 is 0.03 ± 0.12 °C, or no significant temperature change. The most negative greenhouse effect occurs in autumn with its peak in March, which is also the season with the strongest surface cooling.
Arctic Region Was 6 °C Warmer 9000 Years Ago Than Now
A paper Mangerud and Sveden, 2018 used records of a temperature-sensitive species of shallow marine mollusk to determine that the Holocene Thermal Maximum around Svalbard in the Arctic North Atlantic, was 6 °C warmer in August at around 10.2 9.2 thousand years before the present (ka BP). The species, Zirfaea crispate, currently has a northern limit 1000 km farther south. Temperatures declined after 9 ka BP then increased to about 4 °C higher at than the present between 8.2 and 6 ka BP. The warm early-Holocene climate around Svalbard was driven primarily by higher insolation (solar forcing) and greater influx of warm Atlantic water.
Record High Temperatures for Los Angeles Are the Result of a Faulty Weather Stations
Anthony Watts investigated recent hot temperature records in Los Angeles and found that every all time high ' temperature reported by the LA Times is from a station compromised by heat sources and heat sinks. For example, in 2010 the LA Times reported a record high of 113 °F (45 °C) in downtown Los Angeles. The weather station is surrounded by cars and asphalt (image). Another station in Los Angeles on top of a parking garage (image) set a new record of 104 °F (40 °C) on July 7, 2018. There are vehicles parked right next to the weather station. A station at the Van Nuys airport, LA, is between an industrial park, runway, road and taxiway, with a row of planes next to the taxiway. The exhaust from one of the planes may have caused the record high temperature. The weather station at the Burbank Airport, LA, is surrounded by asphalt, parked aircraft, runways and taxiways. The weather station at UCLA is on the room of a building next to air conditioner exhaust vents. All these and other stations violate NOAA 's requirements: A flat, open clearing is desirable so that the thermometer is freely ventilated by the flow of air. Stay at least 100 feet away from concrete or paved surfaces. Avoid balconies, patios, enclosed porches, and beneath eaves. Watts says that all these high temperature reading should be disqualified.
Historic Global Ocean Temperature Data Comedy of Errors
Hartmut Hoecht wrote a review of the methods to measure sea surface temperatures. A May 2008 paper by Thompson et al published in Nature claimed that cooling apparent in the temperature records that started after 1943 was due to the change in the practice of using buckets to sample the water to reading engine cooling water inlet temperatures. Before and after WWII the British fleet used the bucket method to sample the water temperature. Between January 1941 and August 1945, ~80% of observation were from US ship which used mainly engine room water intake measurements and ~5% were from UK ships. But from 1945 and 1949, only ~30% of the observations were from US ships and 50% were from UK ships. Engine room water intake measurements are biased warm compared to using buckets, so datasets were adjusted to reduce the cooling after 1945. Hoecht documents numerous variable random error sources for both types of measurements. He estimates the error of bucket method to by 1.54 °C, or 51 time the desired accuracy of 0.03 °C. Engine intake measurement errors were estimate at 1.6 °C, or 53 times the desired accuracy. Hoecht claims that system errors of measurements often exceed the desired precision of 0.03 °C by up to three orders of magnitude! The articles also discusses errors of the more recent XBT and ARGO measurements.
Commuting to Work: Car, Train or Bus?
Andy May compares the costs of commuting to work by car, light rail and transit bus. Using data from America Automobile Association and the National Transit database, he reports that the total costs per passenger-mile are US$0.35, US$1.40 and US$1.33 for cars, light rail and transit buses, respectively. The miles per US gallon per passenger are 57, 32 and 38 mpg/person for cars, light rail and buses, respectively. The energy use of rail and buses were converted to equivalent regular unleaded gasoline for comparison to cars. Cars are much less expensive and require much less fuel per passenger-mile than public transportation. However, public transportation does reduce highway congestion.
The State of the World 's Beaches
An open access paper examined the historical shoreline change trends using satellite images since 1984. The paper reports that 31% of the world 's ice-free shoreline are sandy or gavel. The study says that 24% of the world 's sandy and gravel beaches are eroding at rates exceeding 0.5 m/yr, while 28% are accreting more than 0.5 m/yr and 48% are stable. In the paper, references to sandy beaches include gravel beaches. More sandy beaches are growing than are receding despite sea level rise. Sandy coasts are highly developed and densely populated due to the amenity and aesthetics that they provide. The study accessed the shorelines using a fully automated analysis of 33 years (1984 2016) of 1.9 million cloud-free Landsat images. The paper says On a global scale, the world 's [sandy and gravel ] beaches have accreted on average 0.33 m/yr over the past three decades, i.e. a total gain of 3,663 km2 over this period.
CliSci # 286 2018-07-05
Solar Minimum and ENSO Prediction
Two scientists at an American Geophysical Union meeting reported observations that link solar activity with the El Ni ±o Southern Oscillation (ENSO). As reported by Javier, the termination of the solar magnetic activity bands at the solar equator that mark the end of the Hale cycle coincides since the 1960 's with a shift from El Ni ±o to La Ni ±a conditions in the Pacific. The scientists say that the probability that the pattern is due to chance is very low, particularly since the termination of the magnetic activity bands at the equator coincides quite precisely with the El Ni ±o-La Ni ±a shift. The abstract says We look at the particulate and radiative implications of these termination points, their temporal recurrence and signature, from the Sun to the Earth, and show the correlated signature of solar cycle termination events and major oceanic oscillations that extend back many decades. A combined one-two punch of reduced particulate forcing and increased radiative forcing that result from the termination of one solar cycle and rapid blossoming of another correlates strongly with a shift from El Ni ±o to La Ni ±a conditions in the Pacific Ocean. They made a prediction at the 2018 Sun-Climate symposium of the Sun-Climate Research Center, Should current projections of solar magnetic band migration hold, we expect the current solar cycle termination to occur in or around April 2020, and thus we expect to see La Ni ±a conditions develop in the Pacific 2-3 months thereafter.
Climate Debate of the Decade ' Video Released
A professionally prepared video of the climate debate of the decade is now available for viewing as reported at WUWT. The publisher wrote On June 12, 2018 renowned experts, Dr. Michael Mann, Dr. David Titley, Dr. Patrick Moore and Dr. Judith Curry met in Charleston, West Virginia to discuss climate change from varying perspectives. The panelists were asked to address two specific questions: To what extent is the use of fossil fuels affecting climate change? What can and should be done to offset those effects? This event was presented by Spilman Thomas & Battle . A pay for view live cast of the debate was technically horrible, so the new video is very welcome.
New Species Are Coming Into Existence Faster Than Ever
Some species of animals and plants are disappearing, but survivors are taking advantage of new opportunities created by humans. They are adapting to new conditions and even evolving into new species, says Chris Thomas, professor of evolutionary biology, University of York. He says In some respects, diversity is actually increasing in the human epoch, the Anthropocene. We should not take a loss-only view of the world 's biodiversity. Many plants and animals are brought to new locations directly by humans, and some extend they range due to changing temperatures. Some invasive species biologist are distraught at the influx of alien species, but it is how the biological world works. Thomas write In general, most of the newcomers fit in, with limited impacts on other species. The net result is that many more species are arriving than are dying out . h/t Ron Clutz
The Atlantic Multidecadal Oscillation Caused Fewer Recent Pacific Tropical Cyclones
Over the 1997 to 2014 period the number of western North Pacific tropical cyclones (TC) has decreased about 18%. The authors of a new paper show that the decline in TC were driven by an increase in vertical wind shear in response to warming in the North Atlantic due to the natural Atlantic Multidecadal Oscillation. The negative phase of the Pacific Decadal Oscillations in the tropical Pacific and anthropogenic forcing play only secondary roles. The results were based on observations and experiments using the Geophysical Fluid Dynamics coupled climate model.
Is Carbon Dioxide Already Doing Almost All the Warming It Can Do?
I received an email about the Skeptic 's Handbook by Joanne Nova. The document suggests skeptics should stick to four main points when debating global warming. Here I review the fourth point on page 8. Joanne writes Adding twice the CO2 doesn 't make twice the difference. The first CO2 molecules matter a lot, but extra ones have less and less effect. This is true, (see chart on page 8) but this effect is very slow from current CO2 concentrations and is included in climate models on which climate policies are based, so this is not an important argument against climate alarmists. The relevant issue is how fast does the CO2 forcing decline over time with more CO2 in the future. Our analysis shows that the feedbacks are close to net zero, so the direct CO2 effect is likely close to the total temperature effect. Here is my graph created by Modtran using the direct CO2 effect. It shows the incremental temperature effects of 20 ppm CO2 increases from 400 ppm to 600 ppm. It takes 74 years for CO2 to increase from 400 ppm (in 2015) to 600 ppm assuming an exponential increase. In that period temperatures increase by only 0.68 °C. The incremental effect of 20 ppm declined 43% over 74 years, which is a quite slow decline. Perhaps skeptics should stick to the other three main point, the predicted greenhouse signature of enhanced warming at around 10 km altitude is missing, ice core records show temperatures increase about 800 years before CO2, and that global temperatures did not rise 2001 to 2014.
Climate Change Reconsidered II Physical Science NIPCC
The Non-governmental International Panel on Climate Change (NIPCC) published a comprehensive analysis on the state of climate science in late 2013. The Executive Summary (and the main report) provides the scientific balance that is missing from the overly alarmist reports of the United Nations ' Intergovernmental Panel on Climate Change, which are highly selective in their review of climate science . Some major point of the Executive Summary are;
- CO2 changes lag changes in temperature by several hundreds of years,
- methane observation are far below the IPCC projected values in all of their assessment reports,
- the Sun may have contributed as much as 66% of the 20th century warming,
- the IPCC ignored the strong empirical correlations reported between solar variability and climate indices,
- the surface temperature record has a large warm bias due to the urban heat island effect,
- climate models show enhanced warming at around 10 km altitude that is not found in the weather balloon or satellite data,
- Claims that warming will lead to more extreme weather is unsupported by empirical evidence.
CliSci # 285 2018-06-14
Dr. Judith Curry 's Presentation at a Major Climate Debate
Climate realists Judith Curry and Patrick Moore debated alarmists Michael Mann and David Titley on June 12 in Charleston, South Carolina. Judith Curry posted her presentation on her blog. She writes that climate primarily changes naturally and there is no simple cause and effect. Ocean oscillations and changes in cloudiness are key natural drivers. Solar indirect effects are potentially very important. She wrote that global sea level rise started about 1860, long before fossil carbon emissions became significant. Greenland 's mass balance loss was larger in the 1920 's and 1930 's than since 2000 and is largely controlled by the natural Atlantic Multidecadal Oscillation. Her personal assessment is Man-made CO2emissions areas likely as not to contributeless than 50% of the recent warming.
Comparing the Current and Early 20th Century Warm Periods in China
A paper by Soon et al 2018 found that temperatures in rural China in the 1940s were higher than at the present, but other researchers found the recent period was much warmer. There are few temperature stations in the 1940s and most have become much more urbanized and subject to the urban heat island effect (UHI). This summary of the paper by Soon and 7 others ranked all the Chinese station by how urbanized they are. The mostly rural stations had the highest temperatures in the 1940s, and the most urbanized stations had the warmest recent period. The paper found that the homogenizing algorithms that are supposed to remove the UHI effect from the records actually blends the effect over all stations, which increases the temperatures of the least urban records. The authors wrote The 1940s warm period seems to have been a real phenomenon in China. Climate models fail to reproduce it.
The Influence of Solar Cycle Lengths on Global Temperatures
A paper published in Journal of Atmospheric and Solar-Terrestrial Physics gives an estimate of the influence of solar cycle length changes and carbon dioxide on global temperatures. The author predicts the global surface temperatures will increase about 1.1 °C by 2100 from the 1996-2016 average. The abstract says, After the CO2 effect has been subtracted out, the SCL explains a healthy 55% of the remaining variance. The author estimates that 37% of the recent warming from 1980 to 2001 was due to solar effects.
Does Global Warming Increase Upper Atmospheric Water Vapor?
Andy May wrote an article comparing various estimates of total and upper atmospheric water vapour to global temperatures. Climate models assume that as air temperatures increase, the amount of water vapour increases at all altitudes. This amplifies the small, direct warming effect of CO2 emissions in the models as water vapour is a strong greenhouse gas. In general, when temperatures increase, so does the lower atmosphere water vapour, but from about 5 to 8 km altitude there is a negative trend in water vapour, contrary to the climate models. Andy writes In the tropics, at the lower levels of the atmosphere, the large amount of water vapor already traps nearly all the IR (infrared radiation), so adding CO2 to this atmosphere has little effect. In the upper troposphere, where infrared radiation is emitted to space, the declining water vapor (according to NCEP reanalysis) may offset rising water vapour in the lower atmosphere. This also explains why there is a four-fold discrepancy [graph] between the tropical mid-troposphere temperature trends in the models and the measurements.
![discrepancy [graph]](http://www.drroyspencer.com/wp-content/uploads/CMIP5-73-models-vs-obs-20N-20S-MT-5-yr-means1.png)
Government Scientist Urges Caution Linking Hurricanes to Warming
Hurricane expert Chris Landsea from the National Hurricane Center in Miami urges the news media to be cautious about linking hurricane activity to global warming. Landsea said, There 's no statistical change over a 130-year period. Since 1970, the number of hurricanes globally is flat. He also believes that hurricane intensity will increase by only a tiny amount. It 's not zero, but it 's in the noise level. It 's very small.
Using Reflective Pavements to Mitigate Urban Heat Island in Warm Climates
The Urban Heat Island (UHI) is the increased ambient temperature of cities compared to rural areas. This paper gives the results of a large UHI mitigation project in Athens. The project used reflective, cool asphaltic and concrete photocatalytic pavement to reduce the surface and ambient temperatures. Extensive monitoring was done over the summer. The abstract says It was concluded that the use of cool non-aged asphalt can reduce the ambient temperature by up to 1.5 °C and the maximum surface temperature reduction could reach 11.5 °C, while the thermal comfort conditions can improve considerably. However, no cost-benefit analysis was mentioned.
CliSci # 284 2018-05-31
Extreme Flood Events Decreasing In Europe Despite Global Warming
A study published in Nature Communications found that the number of flood deaths across Europe has been falling by about 5% per year for the past six decades, while financial losses to flooding have declined by 2% per year. The team of researchers created a list of 1,564 damaging floods that occurred between 1870 and 2016. This is the first comprehensive study of European historical records of floods. The frequency of extreme hydrological events went down during the 20th century, despite global warming. h/t GWPF.
Climate Change May Increase Arable Land
A study shows that warming could expand the boreal region arable land area by 44% by the end of the century. The computer model study, published in Scientific Reports, suggests the northern edge of land suitable for crop growth could shift as far north as 1,200 km from the current position . As the study used models that likely are too sensitive to warming from greenhouse gases, the benefits give are likely exaggerated, but rarely do we see studies showing benefits of warming. h/t GMPF.
Sea Level Rise Is Not Accelerating Significantly
Willis Eschenbach wrote a blog post showing part of the Twitter debate with climate alarmist Gavin Schmidt. Willis wrote, Yes, a quadratic provides a better fit than no acceleration, but NOT significantly better. Which means you can 't claim acceleration. A quadratic fit, by itself, implies the rate of sea level rise is increasing , which is acceleration. Willis used global mean data from 1860 to 2009. There are various periods of accelerating and decelerating sea level rise in the data. Willis shows the best linear fit and the quadratic best fit through the data and calculates that the fits are not significantly different. He concludes, It may just be a random fluctuation, or it might be a real phenomenon. We cannot say at this point. The assumption is that only a real acceleration implies a human influence on sea level rise.
Status of Canadian Polar Bears Updated Map from Environment Canada
Dr. Susan Crockford presents on her blog a new map from Environment Canada giving the population status and trends of polar bears in Canada. The map is included in Canada 's presentation at a meeting of polar bear range states in January 2018. Dr. Crockford reports;
- 7 out of 13 subpopulations are stable, likely stable, increased, or likely increased
- only one is likely reduced (Southern Beaufort)
- 5 out of 13 subpopulations are data deficient
She wrote, With more than half of Canada 's subpopulations either stable or increasing in what are considered by some to be the most vulnerable regions of the Arctic, polar bears are clearly doing well in Canada despite the abrupt decline in summer sea ice .
Climate History in Northern Sweden
A new study which analyzed mega fossil tree remnants has found that summer temperatures in northern Sweden at around 9,500 years ago, corrected for land uplift, were at least 3.6 °C higher at than present-day levels, i.e. first decades of the 21st century. The fossils were recently exposed at the fringe of receding glaciers, at elevations about 600 to 700 m above the current treeline positions. The paper says, This approach has a spatial resolution and accuracy, which exceeds any other option for tree cover reconstruction in high-altitude mountain landscapes. h/t Kenneth Richard.
The High Cost of Getting Climate Policy Wrong
Ken Green wrote an article about the negative impact of federal carbon tax plan on Canada 's economy based on a report by the Parliamentary Budget Office. Assuming all provinces simply rebate carbon price revenue, the size of the Canadian economy would be reduced to the tune of 0.5% in 2020. This represents about $10 billion less economic activity (GDP) in that year alone. Compliance costs would be reduced if provinces reduced harmful taxes instead of issuing household rebates. A carbon tax should replace all other climate regulation and not be used for more government spending, but this never happens, so the PBO likely underestimated the economic costs of the federal carbon tax plan.
CliSci # 283 2018-05-17
What Global Warming? How About Global Cooling?
Madhav Khandekar is a former climate research scientist at Environment Canada and he was an expert reviewer for the Intergovernmental Panel on Climate Change . He wrote The wintry weather held its grip over most of Canada well into April, from Vancouver to St. John 's, as snow, freezing rain, ice pellets and ferocious winds hammered everyone. In the last six years, four winters have been colder than average. In the US and Canada, the cold winters have reduce GDP growth, causing a loss of about US$130 billion. Meanwhile, Canadian federal and provincial politicians are pushing carbon taxes. Reducing carbon dioxide emission will have no measurable impact on the Earth 's climate.
Historical Deforestation Locally Increased the Intensity of Hot Days In Northern Mid-latitudes
The IPCC last report concluded that the biogeophysical effects of historical deforestation led to cooling in the northern mid-latitudes due to albedo changes. More recent observational and modelling studies have highlighted strong seasonal and diurnal contrasts in the temperature response to deforestation. This paper shows that historical deforestation has led to a substantial local warming of hot days over the northern mid-latitudes, contrary to the IPCC report. The moderate reductions in tree cover in these regions have contributed at least one-third of the local present-day warming of the hottest day of the year since pre-industrial time, and were responsible for most of this warming before 1980.
Thailand Temperatures Not Behaving According to Climate Alarmists' Wishes
Climate alarmists often claim that temperatures of the past few decades are the highest they have been over the past one or two millennia. There are numerous studies that refute the claim, and those that support the claim are faulty. A paper by Payomrat et al. (2018) shows a Pine tree-ring proxy for June-September maximum temperatures for northwest Thailand. The proxy is over 226 years (1788-2013 AD). CO2 Science reviewed the paper. The temperatures are not rising in response to the supposedly large CO2 forcing that has occurred in the atmosphere since World War II. Six of the warmest years of the record occurred prior to second half of the 20th century.
Correcting Flaws in Global Warming Projections
Ron Clutz wrote a summary of a paper published posthumously of Dr. Bill Gray 's understanding of global warming/climate change. The global climate models (GCM) all project than an increase in CO2 warming leads to an increase in atmospheric water vapour. This results in the water vapour, which is a strong greenhouse gas, to cause further warming. In contrast to this positive feedback built into GCMs, Dr. Gray believes that there is a negative feedback, meaning that the temperature rise would be less than the direct effect of the theoretical CO2 warming. The paper says CO2 warming ultimately results in less water vapour (not more) in the upper troposphere. The GCMs therefore predict unrealistic warming of global temperature. He hypothesize that theEarth 's energy balance is regulated by precipitation (primarily via deep cumulonimbus (Cb) convection) and that this precipitation counteracts warming due to CO2. The full paper is here.
The Real Culprit Behind Snowmelt Floods Isn 't Temperature It 's Dirt
An article published in Science says that warm weather isn 't the main cause of rapid snow melts off mountains in the western United States. A new study finds that dusty soil can darken snow and accelerate its melting. The article says The findings could establish a new way of forecasting snowmelt flooding and suggest that the current prediction system has been getting it all wrong. Current snowmelt forecasts, which depend heavily on air temperature, get it wrong by as much as 40%. It 's another model failure.
Tracing Winter Temperatures Over the Last Two Millennia
A paper published in Climate of the Past presents a winter temperature reconstruction using fjord sediments from Sweden. The temperature was determined by using a temperature sensitive, stable oxygen isotope in small, shallow water animals. The temperatures range from 2.7 to 7.8 °C. The record shows high temperatures during the Roman Warm Period, variable during the Dark Ages, high temperatures during Medieval Warm Period, cooling with multidecadal variability during the Little Ice Age, and warming during the 20th century. The late 20th century warming does not stand out in the 2500-year perspective and is of the same magnitude as the Roman Warm Period and the Medieval Climate Anomaly. h/t Kenneth Richards.
Evidence Coral Bleaching From 4.0 ka B.P. in the Northern South China Sea
Chinese scientists studied the four massive coral fossils that died 3800 to 4200 years ago in the Northern South China Sea. The study shows that the mortalities of corals frequently occurred, and they were caused by reduced photosynthesis activity of symbiotic algae under the stresses of high thermal and saline conditions. This means the corals died due to coral bleaching. Coral bleaching in the second Holocene Climate Optimum period, indicates that coral bleaching events are not a new phenomena. It is a recurring natural phenomenon and is not due to a gradual temperature change such as that which may be caused by anthropogenic CO2 emissions.
CliSci # 282 2018-04-25
Buy Your Tickets for Extreme Climate Uncertainty
Friends of Science will hold our 15th annual climate science event on May 15th, 2018, 6 9 pm, at the Red and White Club, McMahon Stadium, Calgary. Order your tickets by May 7th, and invite your friends and enemies. Marijn Poels, a Dutch fillmaker will be speaking about his new film The Uncertainty Has Settled . Dr. Madhav Khandekar, a Canadian climate scientist, will be speaking about climate change and extreme weather. A buffet dinner is included. Order tickets here.
The Uncertainty Has Settled
Friends of Science announces the public screening of the award-winning film The Uncertainty Has Settled on one night only in each of Calgary May 14 and Edmonton May 17. The doors open at 6:30 and the presentations start at 7 pm. The cost is only $10, so don 't miss it! The film trailer is here. Order your tickets online for Calgary or Edmonton. See our website for more information.
New Lewis & Curry Study Concludes Climate Sensitivity is Half of Climate Models
A new paper by Nicholas Lewis and Judith Curry titled The impact of recent forcing and ocean heat uptake data on estimates of climate sensitivity shows that climate sensitivity to human-caused emissions of greenhouse gases are half of the average estimate derived from climate models. Nic Lewis wrote a summary of the paper. The study updates an earlier study published in 2015 and addresses criticisms of that paper. IPCC affiliated climate scientists had over the last 34 years presented a likely range of equilibrium climate sensitivity (ECS) in the range of 1.5 to 4.5 °C for a doubling of CO2. The average climate model value is 3.2 °C. The new study shows ECS best estimate is only 1.50 °C using the HadCRUT4 temperature history. Some recent papers suggest the climate sensitivity might be time dependant and observation based estimates are biased low, but the new paper show that this has insignificant effect on the estimate. Dr. Roy Spencer commented on the paper and argued that some of the warming from the mid to late 1800 was a natural recovery from the Little Ice Age. That is, the assumption that the climate was in equilibrium in the 1800s is likely wrong. I estimate that accounting for this would reduce the ECS estimate by 0.23 °C. Correcting for the urban heat island effect might reduce the ESC estimate by 0.20 °C, so perhaps the ESC is only 1.1 °C. If so, the benefits of emissions exceeds the costs.
Atlantic Conveyor Belt ' Has Slowed by 15% Since Mid-20th Century
Two studies show that the Atlantic Meridional Overturning Circulation (AMOC) is in a weaker state now than it has been for decades. The current transports heat from the tropics up to the North Atlantic. The current is driven by the temperature difference between the tropics and the Arctic, so when the Arctic warms, less heat is transported to the north. The Gulf Stream, which is a part of the AMOC, transports salty water northward at the surface. The water cools and sinks and returns southward at deep depths. Warming has caused more precipitation and glacier melting, increasing the flow of fresh water, which is less dense than salt water. The extra freshwater reduces the sinking of the seawater. The two studies differ on when and how they think the weakening was triggered. While one suggests it began in the mid-20th century as a response to human-caused climate change, the second proposes that it began a hundred years earlier following a natural shift in regional climate.
Snowfall in Antarctica Has Increased Over the Last Two Centuries
A team led by the British Antarctic Survey analyzed 79 ice cores from across Antarctica and found that snowfall had increased by 10% over the last 200 years. The increase is equivalent to 272 Gt of water, double the volume of the Dead Sea. The balance between snow accumulation and glacial Ice melt determines Antarctica 's contribution to sea level rise. Another study found that between 30 to 65% of the ice gain due to increasing snowfall is offset by enhance ice loss along the coast, so on a net basis, the 10% increase in snowfall results in 3.5 to 7% increase in total ice gain, helping to reduce sea level rise.
Weather Satellite Drift Contaminates the RSS Temperature Dataset
A study led by Dr. John Christy compared temperature measurement from several satellites and weather balloons and found that data from the NOAA-12 and NOAA-14 satellites contain spurious warming in three of the four satellite datasets. The Remote Sensing System (RSS) dataset includes the NOAA-12 satellite with has a large warm bias. The spurious warming in the central estimate trend of RSS is at least +0.04 °C/decade. The University of Alabama in Huntsville (UAH) satellite dataset determines corrections for the drift of the spacecraft through the diurnal cycle using empirical evidence only, i.e. intercomparing diurnally-drifting vs. non-diurnally-drifting satellites to calculate the effect directly. RSS and NOAA apply climate-model-calculated values which are evidently not sufficiently satisfactory. The UAH data tend to agree with (a) IGRA radiosondes, (b) independently homogenized radiosonde datasets and (c) Reanalyzes at a higher level, sometimes significantly so, than the other three. On the strength of this analysis the main satellite temperature graph presented on the Friends of Science website home page will from now on use the UAH satellite dataset only, rather than the average of the UAH and RSS datasets. A summary of the study is here.
Science, Philosophy and Inquiry on a Galactic Scale: Dr. Willie Soon
The Friends of Science blog presents many excellent articles. Here I summarize a post of an interview with Dr. Willie Soon, and independent solar physicist at the Harvard Smithsonian Center for Astrophysics who has been studying the Sun and its influence on the Earth 's climate for more than a quarter of a century. He explains that polar bears are little endangered by global warming and too much ice is far more dangerous because their main food source, seals, require open water to survive. Dr. Soon explains that the sun has an important effect on climate. The sun modulates the size of rain-belts in the Pacific warm pool, and the monsoonal rainfall is strongly correlated with solar radiation. The Maunder Minimum of low solar activity correspond to low temperatures. In scientific inquiry, fully open and objective transparency especially concerning the methodology and openness of datasets is the most important requirement. Unfortunately, this is often not the case in climate science.
CliSci # 281 2018-03-31
State of the Climate Report
Emeritus Professor Ole Humlum of the University of Oslo prepared this new report on the state of the climate. He is the proprietor of the website Climate4you, that provides data and information on climate. Professor Humlum writes, It is clear that temperatures in the troposphere are continuing to diverge from surface temperatures. In other words, they are warming more slowly than global warming theory says they should. The contrast with theory is even more marked in the stratosphere, where temperatures have barely changed for 23 years. Some key findings are; at the end of 2017 the average global surface temperature was dropping back toward levels before the record 2015-16 El Ni ±o episode; since 2003 the average global temperature estimates based on surface weather stations has steadily diverged in the warm direction from satellite-based estimates; and data from tide-gauges all over the world suggest an average global sea-level rise of 1-1.5 mm/year, while the satellite-derived estimates suggest a rise of more than twice the rate of about 3.2 mm/year.
Southern Ocean Sea Ice is Expanding
A South American research team of De Santis et al. (2017) used passive microwave satellite data from 1979 to 2016 to assess the trends in sea ice extent for the Southern Ocean and five sub-regions. The trends were compared over time. The results show the positive sea ice extent trend has been increasing from about 1% per decade (1979-2006) to 1.6 % per decade (1979-2016). Four of the five regions show regions show positive sea ice trends. The only region with a negative trend is in the Bellingshausen-Amundsen Seas, where the trend is getting less negative in recent years. The trends were compared to meteorological variables which led the authors to conclude that the increase in sea ice extent is mostly due to thermodynamic effects of winds. However, one thing is certain; all of the climate models have failed to predict the increase in Southern Ocean sea ice extent. The models forecast that global warming was supposed to reduce sea ice extent, so something is fundamentally wrong with the climate models. See a review of the paper at CO2 Science.
Henrik & Jacob Svensmark Interview: The Connection Between Cosmic Rays, Clouds and Climate
Prof Henrik Svensmark & Jacob Svensmark discuss the connection between cosmic rays, clouds and climate with the GWPF 's Benny Peiser and Jonny Bairstow from Energy Live News in this video interview. They explain that charged ions created by cosmic rays attach to small aerosols, also caused by cosmic rays, that cause the aerosols to grow large enough to become cloud condensing nuclei. Lower solar activity that is predicated over the next several decades is associated with low solar wind, that would allow more cosmic rays into the atmosphere. The cosmic rays create aerosol that grow with the help of charged ion into large aerosol that seed cloud droplets, enhancing clouds which reflect solar radiation. The scientists believe the lower solar activity will offset all of the warming effects of emissions, but this is still uncertain.
Climate Tutorial: Happer, Koonin, Lindzen (Climate Alarmism on Trial)
Dr. William Happer, President of the CO2 Coalition; Dr. Richard Lindzen and Dr. Steven Koonin have submitted a document to the court concerning lawsuits filed by Oakland, San Francisco, et al. against certain large oil companies in response to U.S. District Judge William Alsup 's request for a tutorial on climate change and climate science. Robert Bradley Jr. wrote this summary of the 31 page document. The document presents a large amount of data and evidence that CO2 emissions do not pose an imminent threat to the earth 's climate. Some conclusions are; climate changes of the past half-century are common in the geologic record, driven by powerful natural phenomena; human influences on the climate are a small (1%) perturbation to natural energy flows; it is not possible to tell how much of the modest recent warming can be ascribed to human influences; and there have been no detrimental changes observed in the most salient climate variables. Historical data show that weather extremes are not becoming more common globally.
Northern Snow Cover and Sea Ice Extent Are High
The snow and ice in the northern hemisphere has shown surprising extents despite increasing CO2 emissions. A post by Peter Gosselin presents a chart of northern hemisphere snow cover extent that shows the current snow cover is more than one standard deviation above the 1998 2011 average. A graph from the Finnish Meteorological Institute shows the northern snow mass has been exceptionally high. Sea ice volume has increased at a fast rate in March and are near normal levels. This large snow and ice extent seems to contradict the surface temperature measurements. Ocean temperatures have a major effect on ice extent. Gosselin writes Below the earth 's surface we have kilometers of a vast dynamic ocean, whose mass is 100 times that of the atmosphere above us. The ocean is in a state of constant of flux involving huge complex currents and cycles with periods ranging from months to centuries. Very few of these cycles are understood to any appreciable extent. Scientists are still not able to forecast the ENSO.
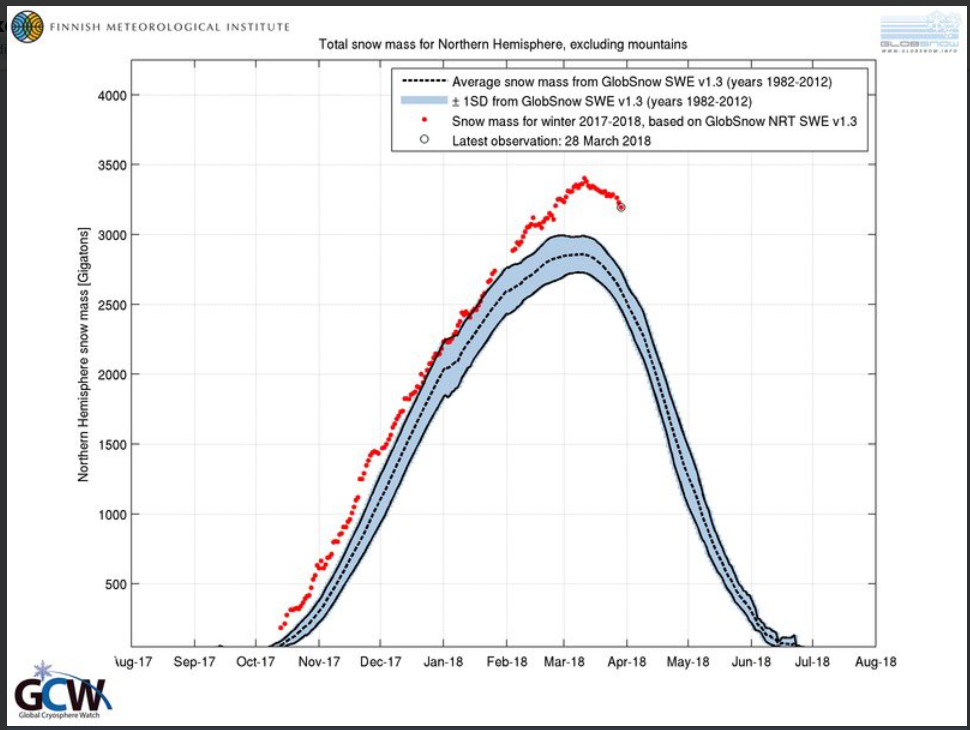
CliSci # 280 2018-03-14
Fewer People Die From Climate-Related Natural Disasters
Bj ¸rn Lomborg writes on his Facebook page Fewer and fewer people die from climate-related natural disasters. He presents a graph that shows deaths per year of climate-related deaths and no-climate-related deaths (earthquakes, Tsunamis, volcanos). The data is from the International Disaster Database. The story is reported at WUWT. The climate related deaths declined from 485,000 per year in the 1920s to 34,000 per year in the 2010-2017 period. This is a 93% decline over a period when the global population increased by a factor of four. There is likely under-reporting in the earlier decades, so the decline in deaths may be underestimated. The individual risk of dying from climate-related disasters has declined by 98.9%. Lomborg writes our increased wealth and adaptive capacity has vastly outdone any negative impact from climate .
Aerosol Effects on Cloud Water Amounts
A study published March 7, 2018 in Nature Communications says that in climate models, the mass of liquid water is assumed to increase monotonically with increasing aerosol loading. However, recent satellite observations shows that the liquid water mass can decrease with increasing aerosol loading, implying that climate models overestimate the aerosol effect. This paper reproduces the satellite-observed liquid water mass responses using a global simulation with explicit representations of cloud microphysics. The authors report that the decrease in liquid water in clouds is due to the response of evaporation and condensation processes to aerosol perturbations, which are not represented in climate models. The negative aerosol-cloud interactive in climate models need to be significantly reduced and the uncertainty range could even include positive values. The total aerosol effect is the sum of the aerosol-cloud interaction and the direct aerosol effect without clouds. Using the results of this study, Frank Bosse wrote a post where he estimates the total aerosol effect is about half of that given by the climate models ' mean. This implies that aerosols cannot offset the large positive feedbacks assumed in climate models and the climate models must reduce the greenhouse gas sensitivity in order to match the historical temperature record.
The Solar Variability Effect on Climate
Javier wrote an interesting essay showing the strong effect of the millennium solar cycle (or Eddy solar cycle) on Earth 's climate. He uses a solar activity reconstruction from Steinhilber et al., 2012 which uses both 14C and 10Be isotopes. A frequency analysis on the data shows that the millennium cycle (actually 980 years) is by far the most prominent. This is very similar to the Asian monsoon frequency analysis, which also has the most prominent frequency at the same periodicity. Javier uses the Bond series of ice-rafted debris that is a proxy for iceberg activity and climate. The match is very good except during the period between 4100 1800 before BP (1950). A wavelet spectrum of solar activity over the past 9400 years by Steinhilber & Beer 2013 shows that the 980 year cycle fall in power over the 4100 1800 BP period, explaining why there is a poor solar-climate match over that period. The modern warming corresponds to a period of high Eddy cycle solar activity. Javier also shows that there are several time lags corresponding to different indirect solar effects. There is a 10 to 40 year time lag between solar forcing and Greenland temperatures that are related to the slowdown of the Atlantic Meridional Overturning Circulation. Multiply time lags means that there is roughly a 20 year time lag for the full effect of solar variability to be felt on climate.
Subsidize Fossil Fuels to Optimize the Net Benefits
I was the Key Note Speaker at the IEEE IAS ESTMP Workshop at the Hyatt Regency Hotel in Calgary on March 12. The first part of that alphabet soup is IEEE = Institute of Electrical and Electronics Engineers. In the presentation I presented evidence of low climate sensitivity to greenhouse gas emissions. I estimate the net global benefit of CO2 emissions is about US$5/tCO2 based on output of the FUND economic model with a transient climate response of 0.85 °C/double CO2. The private benefit of fossil fuels according to calculations by Richard Tol, the developer of the FUND model, is US$411/tCO2, so the total benefit of fossil fuel use including the effects of emissions is US$416/tCO2. See page 26 of the presentation. Even if CO2 emissions caused a net social cost, say $30/tCO2, which is equivalent to the Alberta CO2 tax, the private benefit of fossil fuels overwhelms the alleged social cost. Therefore, calls to eliminate fossil fuel use are crazy, as they ignore the benefits to consumers of fossil fuels. The private benefit of fossil fuels for residential electricity is US1875/tCO2. If there is a net social cost of CO2 emissions and if the tax and royalty rate on fossil fuels is equal to that of other sources of energy sources, increasing the cost of fossil fuels by that social cost would cause the optimal amount of fossil fuel usage and optimal CO2 emission, as long as there are no subsidies to other sources of energy, and no other climate policies. The optimum is achieved when the marginal benefit of fossil fuels is equal to the marginal cost of producing the fuel plus the alleged social costs. However, since using a realistic estimate of climate sensitivity with the FUND model gives a net social benefit of emissions, the use of fossil fuels should be subsidized to optimize the net benefits.
CliSci # 279 2018-03-02
Polar Bears Are Thriving, New Report Shows
The Global Warming Policy Foundation issued a new report on the state of polar bears authored by polar bear expert Dr. Susan Crockford of the University of Victoria. The report shows the global polar bear numbers have been stable or risen slightly since 2005 despite that summer sea ice declined to a level where it was predicted to cause a 67% decline in polar bear numbers. Abundant prey and adequate sea ice in the spring and early summer since 2007 explain why global polar bear numbers have not declined. The record low sea ice extent in March 2017 had no impact of polar bear health or survival. The US Geological Survey estimate the global polar bear population at 24,500 in 2005. The current estimate is 28,500 polar bears with a relatively wide margin of error, about ±5,000. Several subpopulations have never been comprehensively surveyed.
Sea Level Rise in Four Parts
Dr. Judith Curry has published a series of four blog post about the science of sea level rise. Part 1 give an introduction which shows statements from IPCC reports an sea level rise (SLR) and compares those to tidal ranges and storm surges. The last IPCC report says global sea levels rose by about 19 cm from 1901 to 2010, and the projected rise from 1996 to 2091 (95 years) is about 48 cm for the RCP6.0 scenario. Tides can change by 11 m and storm surges can reach 9 m. Part 2 discusses causes of SLR and the geological evidence for past SRL. The rate of SLR was during the last interglacial was higher than the rate during the 20th century. Part 3 reviews SLR during the 19th and 20th century. The rates are estimated from tide gauges and by summing the components that contribute to SLR. Recent analyses of 20th century sea level rise find significantly lower values than were cited in the IPCC AR4 and AR5. These lower values between 1900-1990 are more consistent with integral constraints from mass budget analyses. Part 4 reviews SLR during the satellite era. Complex adjustments are required to convert the satellite signal to SLR, and the errors may be substantial. The radar wave travel time through the atmosphere is affected by the amount of water vapor, effects of the ionosphere, the ocean surface state including wave height, tides and atmospheric pressure. Short term SLR is strongly correlated with ENSO. There was a significant increase in SLR during the 1990, but this is mainly due to increases in the Indian Ocean and the southern Pacific region. There are still large uncertainty in the SLR estimates, and even larger uncertainty in the fraction of the SLR that is caused by mankind versus by nature.
A simple Climate Model Matched to Observation Gives Low Climate Sensitivity
Dr. Roy Spencer published a study using a simple climate model whose parameters are matched to the HadCRUT4 temperature record, the ocean heat content changes and ENSO (El Ni ±o Southern Oscillation). The model includes estimates greenhouse gas and aerosol forcing and ENSO related radiative forcings. Some parameters are adjusted to best match the observations. The resulting climate sensitivity to a doubling of CO2 concentrations is 1.54 °C, which is only 45% of the IPCC model average of 3.4 °C. This explains why the climate models overestimate warming compared to the measurements. The model well matches the strong warming trend from the 1890s to 1945 and the cooling to 1975. These temperature trends are explained by the ENSO radiative forcing, which the IPCC models lack. The IPCC climate models do not match these periods. A major result of the study is that the usual (IPCC) interpretation of a comparison of radiative fluxes to temperature to estimate climate sensitivity is very flawed as this gives an interpreted climate sensitivity of 3.25 °C even though the actual climate sensitivity specified in the model is only 1.45 °C. The top-of-atmosphere radiative fluxes cannot be used to diagnose the climate sensitivity because the ENSO radiative forcing due to cloud changes decorrelate the feedback flux relationship to temperature. In my opinion, the climate sensitivity estimate from the model is still significantly too high because long term recovery from the Little Ice Age and urban heat island warming included in the temperature index is falsely attributed to greenhouse gases.
Atlantic Multidecadal Oscillation modulates Arctic Sea Ice
The Arctic sea ice extent has declined in recent years due to the warm phase of the Atlantic Multidecadal Ascillation (AMO) that began in 1996. This paper published last month investigated the relationship between the AMO and the Arctic sea ice in the Atlantic sector. The study reports that the cold phase of the AMO increases Ural blocking, the snowpack and a cold Eurasia continent in the winter. The increased Ural blocking and larger snowpack leads to a weakened stratospheric polar vortex and a negative Arctic Oscillation phase at the surface in February. During the warm AMO phase, the stratosphere-troposphere coupling is suppressed and there is no negative AO anomaly in February. The cold AMO phase regulates the atmospheric response to the Arctic sea ice decline.
Projections of Future Tropical Cyclone Damage
A model study using a climate model and a tropical cyclone damage model was used to simulate economic damages due to tropical storms in response to warming. The study claims the damage model produces reasonable damage estimates compared to observations. The damage estimates are highly dependent on the internal variability of the coupled system, so damages uncertainly is ±40%. The model result indicate that the number of cyclone will decline in the future but the intensity of strong storms will increase. There is little benefit is seen from mitigation. The projected increase in the vulnerable assets increases damages by more than three-fold, so future growth will swamp the potential changes in tropical cyclones.
United States Hurricane Landfall Frequency and Damages
A new study reports that since 1900 neither the frequency nor intensity of US landfalling hurricanes show significant trends, including the devastating 2017 season. The El Ni ±o-Southern Oscillation (ENSO) and the Atlantic Multi-decadal Oscillation (AMO) significantly impact the US landfalling hurricane activity. There are more US landfalling hurricanes during La Ni ±a and the positive phase of the AMO. The growth of coastal populations and wealth are the overwhelming drivers of hurricane-related damages. Losses from future hurricanes have significant potential to dwarf those of the past based on societal change alone.
97 New Papers Published in the First 8 Weeks of 2018 Support a Skeptical Position on Climate Alarm
Kenneth Richard reports In just the first 8 weeks of 2018, 97 scientific papers have been published that cast doubt on the position that anthropogenic CO2 emissions function as the climate 's fundamental control knob or that otherwise serve to question the efficacy of climate models or the related consensus positions commonly endorsed by policymakers and mainstream media sources. Climate science is far from settled, but it is becoming very clear that the IPCC 's position on climate is far too alarmist. Natural mechanisms play a large role in climate change. The recent warming, sea levels and extreme weather are well within the range of natural variability. Climate models are far too sensitive to greenhouse gas emissions and current emissions mitigation policies are ineffective and even harmful to the environment.
CliSci # 278 2018-02-12
Pacific Islands Nation of Tuvalu Is Growing in Size
A study published in Nature Communications found that 8 of the 9 atolls and almost three-quarters of the 101 reef islands of Tubalu grew in size between 1971 and 2014, increasing Tuvalu 's total land area by 2.9%, even though sea level rose at twice the global average. The authors used satellite imagery and aerial photography to document the changes in the islands ' areas. Tuvalu is a nation comprising of 9 major islands and many minor islands in the tropical Pacific Ocean. The paper challenges the usual narrative that low-lying island nations would be swamped as the sea levels rise. The study found that factors such as wave patterns and sediment dumped by storms could offset the erosion caused by rising sea levels. Rather than accepting their homes are doomed and looking to migrate to countries such as Australia and New Zealand, the researchers say they should start planning for a long-term future. See a Breitbart article here.
Ultraviolet Flux Decrease Under a Grand Minimum from Observation of Solar Analogs
A team of scientists from California identified 33 sun-like stars to estimate the decrease in ultraviolet (UV) radiation on Earth associated with our sun entering into a grand-minimum state. The scientists used 20 years of observations by the satellite International Ultraviolet Explorer to find the solar analogues. The authors estimate a range of UV flux of 9.3% over solar cycle 22 and a reduction of 6.9% below solar cycle minimum under a grand minimum. Solar activity has declined over the last three solar cycles and most solar scientists believe that the sun may be entering a grand minimum state of low solar output. The reduced UV energy from the Sun sets into motion a sequence of events on Earth beginning with a thinning of the stratospheric ozone layer. That thinning, in turn, changes the temperature structure of the stratosphere, which then changes the dynamics of the lower atmosphere, especially wind and weather patterns. A cold period in the northern hemisphere during the 17th century is attributed mainly to the Maunder Minimum, which was a grand minimum of solar activity. See a blog post here.
Global Sea-Level Reconstruction and Its Budget Over 1958 2014
A new paper, Frederiske et al, 2018, used tide gauge records combined with observation of vertical land motion, estimates of ice-mass loss, land water storage and atmospheric pressure to reconstruct sea level changes on basin and global scales, which are compared to the estimated sum of the contributing processes. The authors show that the sea level rise and acceleration can be explained by the sum of contributors, as well as a large part of the decadal variability. The global sea level reconstruction shows a trend of 1.5 mm/yr over 1958 to 2014, compared to 1.3 mm/yr for the sum of contributors. Over the same period, there was an acceleration of 0.07 mm/yr2. Sea level rise from 1993 to 2015 was 2.76 mm/yr, which is 0.29 mm/yr less than the 3.05 mm/yr (GIA not included) recorded by satellite altimetry data.
Climate Influences on Caribou Body Condition and Abundance in Northern Canada
A paper published last month shows that the body condition and population of caribou in northern Canada are strongly correlated with the Arctic Oscillation (AO), where the positive phase of the AO in summer were associated with warmer temperatures, more vegetation, better body condition of caribou and increased fertility. The AO is an atmospheric oscillation where during the positive phase the atmospheric pressure over the Arctic is lower than average, which results in warmer winters in northern regions as warmer air is able to move further north. The caribou herd populations followed the direction of the AO. From 1988 to 1996, the AO was positive corresponding to population growth, and from 1997 to 2016, the AO was in the negative phase causing cooling when the caribou populations declined. The positive AO intensity in the summer corresponds to warmer average temperatures and a longer growing season and improved foraging conditions for caribou. This leads to caribou in better physical condition going into winter, perhaps reducing adult winter mortality, and increasing rates of fecundity and late-winter calf survival.
Ozone Layer Isn't Healing After All
Ozone is created by ultraviolet radiation interactions with oxygen in the stratosphere. The ozone layer protects us from most of the sun 's harmful ultra-violet radiation. Halogen-containing ozone-depleting substances were banned by the Montreal Protocol, effective January 1, 1989. A paper published this month reports that the total column amount of ozone between the earth and the top of the atmosphere has stopped declining, but no clear increase has been observed at latitudes between 60 ° S and 60 ° N. Ozone in the lower stratosphere between 60 ° S and 60 ° N has continued to decline since 1998 while the upper stratosphere ozone was recovering, but the decline in the lower stratosphere was greater so the total stratosphere ozone continued to decline. The ozone in the troposphere has been increasing, which compensates for the stratospheric ozone decreases. The reasons for the continued reduction of lower stratospheric ozone are not clear and atmospheric models do not reproduce these trends.
Critiquing Marvel el al 's paper on Climate Sensitivity from Observations
Kate Marvel, Gavin Schmidt of NASA and others recently published a model-based paper that claims estimates of climate sensitivity (CS) based on observations of historical data are biased low. Critiquing other people 's work is a very important part of the scientific method. Climatologist Nic Lewis published a critique of this paper on two climate blogs, Climate Audit and Climate Etc. The Marvel paper shows that climate models project stronger positive feedbacks in the far future, but Nic writes the fact that models project more positive climate feedbacks in the future does not in any way prove that the models are correct in doing so. Nic shows that the paper presents three invalid arguments to support this conjecture. The paper argues that a CO2 increase from a doubling to a quadrupling causes more temperature change than the first doubling, but this is explained by the fact that CO2 forcing increases slightly faster than logarithmically with its concentration, rather than from stronger feedbacks. Observation-based estimates of CS extrapolate only from about 1.4 to 2 times CO2, where the logarithmic assumption is valid. The paper argues that CS inferred from recent history of 26 years is lower than that from an abrupt quadrupling of CO2, but observational studies use very long periods. That 26 year period is unsuited for CS estimates because there was strong volcanic forcing during the early part of the period which biases the calculations. In short, we see no reason to assume that feedbacks become stronger in the future, so CS estimates based on historical data are likely valid for the next few centuries.
CliSci # 277 2018-02-02
Oceans Cool Off Previous 3 Years
Blogger Ron Clutz presented a plot of sea surface temperatures (SST) showing the global SST declined by 0.94 °C from Jan 2016 to Dec 2017. He writes, All parts of the ocean are clearly lower than at any time in the past 3 years. For Reference: Global SSTs are the lowest since 3/2013 Tropics SSTs are the lowest since 3/3012 . The period is dominated by the recent, strong El Nino that peaked in January, 2016. Weak La Nina conditions are forecast to persist throughout 2018. The tropical troposphere temperature in January 2018 dropped 0.38 °C, the third largest monthly decline in the UAH satellite record. This is the lowest tropical temperature since June, 2012. La Ni ±a conditions are usually defined as when the sea surface temperatures in a region in the tropical Pacific named Nina3.4 [5N-5S, 170W-120W] is more than 0.5 °C cooler than the 1951 2000 average. We were in mild La Ni ±a conditions in September and October, and strong La Ni ±a in November. There is a several month delay between the cooling at the sea surface and in the lower troposphere.
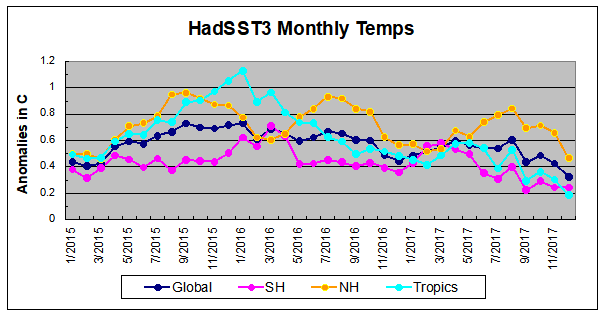
The Cosmogenic Isotope Record and the Role of The Sun in Shaping Earth 's Climate
Euan Mearns wrote a excellent article on the hard scientific evidence from cosmogenic isotope variations that the sun has a major effect on earth 's climate. Cosmogenic isotopes 10Be and 14C are used to study the solar variability. 10Be and 14C are radioactive isotopes of beryllium and carbon, respectively. Both are caused by cosmic ray collisions with oxygen and nitrogen atoms. The cosmic ray flux varies inversely with the solar magnetic field strength. High solar intensity and magnetic field strength deflect the cosmic rays away from the earth. This changes the amount of 14C found in trees and carbonate minerals and the amount of 10Be measured in snow and ice, so both isotopes are excellent proxies for solar variability. Mearns presents a graph showing a strong correlation between 10Be (solar activity) and temperature from a Greenland ice core record. Sediment cores from the north Atlantic show the sediments dropped by melting ice bergs which match the record of known climate events. The drift ice record matches the 14C and 10Be records with very strong correlations. Isotope records from stalagmites also show very strong correlations between the 14C solar proxy and climate. This provides strong evidence that the sun controls Holocene climate fluctuations.
German CO2 Reductions to Cost US$2.8 Trillion More by 2050
A new study by the German Federation of Industry has found that it would cost Germany up to an additional US$2.8 trillion to reach its Paris Accord emission reduction targets of 2050. Germany currently emits 2% of the world 's CO2 emissions. This suggests that reducing global emissions by 95% would cost up to US$140 trillion if costs are proportional in other countries. The study is reviewed by P. Gosselin. The German news website Welt discusses the study.Meanwhile, Germany 's CO2 emissions have not fallen at all since 2009, a period of 7 years despite emissions reduction expenditures of 20 to 40 billion US dollars per year.
The Resilience of a Coralline Red Algae to Ocean Acidification
CO2 Science reviewed a paper by Donald et al (2017) that examined the boron isotopic composition of a coralline red algae to investigate how its pH was impacted by ocean acidification. The calcareous organisms were grown in four seawater pH conditions. The researchers found that the organisms increased the pH at the site of calcification, counteracting the seawater pH by 1.2 pH units. By increasing the pH at the organisms surface it increased its rate of calcification, which the authors say is most likely due to CO2 fertilization of algal photosynthesis . The reviewer said this coralline red algae may improve its calcification rate in the decades and even centuries to come.
Ampliï cation of Arctic Warming by Past Air Pollution Reductions in Europe
A paper Navarro et al (2016) used an Earth System model with comprehensive aerosol physics to show that sulfate aerosol reductions in Europe from 1980 to 2005 may explain 0.54 °C of Arctic warming over the period. The SO2 emissions have declined by 60%. The measured warming (70N 90N) is 0.85 C (average of HadCRUT4 and NCDC), so sulfate emissions may explain 63% of the warming. The Arctic warming is amplified mainly in fall and winter, but is initiated in the summer. The summertime energy surplus reduces sea ice cover which causes heat transfer from the Arctic Ocean to the atmosphere. The sulfate aerosols in the atmosphere scatter sunlight causing cooling, so the reduction of these aerosols causes warming. The aerosols make clouds more reflective and long-lived. Black soot on snow and greenhouse gases may have together causes 37% of the arctic warming.
Multidecadal Variability in Temperatures Related to the Atlantic Meridional Overturning Circulation
A paper, Stolpe et al 2018, used computer models to simulate how variations in the Atlantic Meridional Overturning Circulation (AMOC) affects hemispheric and global air temperatures, and ocean heat content. The AMOC is a system of Atlantic Ocean currents that includes a northward flow of warm water in the upper layers of the Atlantic, including the Gulf Stream, and a southward flow of colder deep water. The system moves heat from the tropics to the North Atlantic. The AMOC variations are chaotic, so the simulations show a large spread of air temperatures. Deep convection in the Labrador Sea controls these temperature trends. A strengthening AMOC lead to decreased heat storage in the Atlantic and more heat in the top 300 m of the global oceans. The abstract claims that the AMOC is a control knob on deep-ocean heat storage. Global air temperatures are significantly altered on multi-decadal time scale by the AMOC variability. Chaotic ocean processes might have caused much of the recent warming.
Does Replacing Coal with Wood Lower CO2 Emissions?
The European Union has declared that biofuels are carbon-neutral and provides financial incentives for burning wood, causing a surge in wood usage for generating electricity. A study by Sterman et al 2018 published in Environmental Research Letters shows that the immediate impact of replacing coal with wood is to increase CO2 emissions. The authors calculate that the payback time for this carbon debt ranges from 44 to 104 years after clearcut, depending on the forest type and assuming the land remains forest. Replacing hardwood forest with faster growing pine plantations raises the CO2 impact. The projected growth in wood use would increase CO2 levels for at least a century because new carbon dept continuously exceeds CO2 uptake by replanted forests.
CliSci # 276 2018-01-17
Climate Models Underestimate Cooling Effect of Daily Cloud Cycle
A paper published in Nature Communications compared the diurnal, or daily, cloud cycle as measured by satellites and reanalysis data to that projected by a suite of climate models and found that the climate models underestimate the cooling effect that clouds have on a daily basis, particularly over land. The researchers found that the discrepancies over the daily cycle increased the margin of error of climate model projections. The daily cloud cycle error results in the models warming the earth 's surface with an extra 1 to 2 W/m2 of solar energy. This is a significant error as it is large compared to the estimated forcing of greenhouse gases from pre-industrial times to 2011 of 2.3 W/m2 reported in AR5. The models have too little cloud cover in the early afternoon when the sun 's intensity is the greatest. The poor performance of the climate models in simulating the diurnal cloud cycle indicates deficiencies in modeling the behavior of water vapour and surface heating which affect cloud formation. The paper is here and a summary is here.
Global Ocean Temperatures During the Last Glacial Transition
Researchers at Scripps Institution of Oceanography published results in the Journal Nature of a new method to determine the global average ocean temperatures. The method involves measuring the ratio of three noble gases, argon, krypton and xenon, trapped in Antarctic ice cores. As the oceans warm, these gases are released into the atmosphere in known quantities, so the ratio of the quantity of the gases allows for the calculation of the average global ocean temperature, from the ocean floor to the surface. The study focused on the period 8,000 to 22,000 years ago, which includes the last glacial transition. The average global ocean temperature increased from 0.9 °C to 3.5 °C. The authors claim that the measurement precision is about 0.2 °C. The warming of the past 50 years is only about 0.1 °C. The news release is here. A WUWT article about the study is here.
Sea Level Rise Acceleration (or Not)
Judith Curry has started a five part blog post examining sea level rise. The first part shows statements from the five IPCC assessment reports. The 5th report states It is very likely that the mean rate of global averaged sea level rise was 2.0 [1.7 to 2.3] mm yr 1 between 1971 and 2010. Global mean sea level rise for 2081 ˆ’2100 relative to 1986 2005 will likely be in the ranges of 0.33 to 0.63 m for RCP6.0 . For context, she compares these changes to tidal ranges that can be up to 11 m. Storm surges can reach 9 m. Ground water and petroleum extraction has cause subsidence of 3 m in Houston since 1920. Curry writes emissions reductions will have little or no impact on the course of sea level rise this century. Eliminating emissions would reduce sea level rise by only a small fraction in the most vulnerable locations where most relative sea level rise is due to subsidence. In comments, I wrote Using this estimate [ECS = 1.0 °C] and a 5% discount rate, the FUND model shows that the sea level rise impact is only -0.0049% of gross domestic product (GDP). That can be compared to the agriculture impact of +0.461% of GDP, and the sum of all global impacts is +0.353% of GDP. The + sign means that impacts are beneficial.
The Antarctic Centennial Oscillation: A Natural Cycle That Influences Global Temperature
An open access paper published in the journal Climate (Davis et al 2018) provides an assessment of the role of the Antarctic Centennial Oscillation (ACO) in global climate change. The oscillation is recorded in ice cores from Antarctica and according to the paper can be traced over the last 226 millennia. The ACO varies in intensity over millennial periodicity. The authors found that the ACO oscillate in phase with glacial cycles and planetary orbital forces. The authors conclude that properties of the ACO can explain the current global warming signal. See more here.
Tornadoes Are Becoming Less Frequent Since 2005
Dr. L ¼ning and Prof. Vahrenholt reviews the recent frequency of tornadoes in the USA. The reported frequency of tornadoes have increased to 2005, but much of the increase may be due to better radar that can record small tornadoes. A graph here by NOAA shows that the frequency of F3 and stronger tornadoes declined significantly since the 1970s. Tornado activity is influenced by the Pacific Decadal Oscillation (PDO), an oscillation of the pattern of Pacific Ocean surface temperatures. The PDO affects the route of the jet stream which trigger tornado- producing storms. A paper (open access) by Lepore et al 2017 found that the ENSO state can be used to improve the prediction of tornadoes. The December to February (DJF) ENSO state can be predicted several month in advance. The paper shows that the predicted ENSO state available in early October can improve forecasts of severe convective storms that create tornadoes in March to May of the following year.
485 Scientific Paper Published in 2017 Support Climate Skepticism
Kenneth Richard compiled a list of 485 scientific papers that cast doubt on the consensus position of climate alarmism. The papers are categorized into three parts,
An Analysis of Climate Forcings from the Central England Temperature (CET) Record
A paper published in the British Journal of Environment & Climate Change used the world 's longest instrument temperature record to attribute greenhouse gas emissions to one-third of the temperature increase from the mid-late 18th century to the present day, and two-thirds to natural climate change. The author found that the temperature variations of the Central England Temperature (CET) record from 1659 to late 18th century can be explained by fluctuation in the solar output alone. Solar forcing is required to explain the temperature decline at the end of 17th century, the rapid temperature rise in the early 18th century and the temperature decline to the early 19th century as shown by this graph. The paper says There is good correspondence with [total solar irradiance] TSI throughout the CET record, with warm events correlating with high TSI and cool phases correlating with plateaus or decreases in TSI.
CliSci # 275 2018-01-02
Cosmic Rays Supports Growth of Aerosols into Cloud Condensation Nuclei
A paper by Henrik Svensmark et al published in Nature Communications last month shows that the flux of cosmic rays, which are modulated by changing solar activity, creates ions that significantly promotes the growth of aerosols to a size that enhances cloud formation by several percent. A decreasing solar wind increases the cosmic ray flux which increases the amount of cloud condensing nuclei (CCN), increasing cloud cover which reduces the solar energy reaching the earth 's surface, causing cooling. Experiments performed in a reaction chamber found that an increase in ionization results in a faster aerosol growth, which lowers the probability for the growing aerosol to be lost to existing particles, and more aerosols can survive to CCN sizes. The effect would be significant only in pristine marine settings away from pollution where the density of aerosols is small. The paper says The mechanism could therefore be a natural explanation for the observed correlations between past climate variations and cosmic rays, modulated by either solar activity or caused by supernova activity in the solar neighborhood on very long time scales. . See a discussion here. Several studies of cloud data shows that the ionization effect on total cloud cover is small, see here.
Weak Stratospheric Polar Vortex States Linked to Cold Extremes
The extra-tropical stratosphere is characterized by a strong circumpolar westerly jet, named the polar vortex, that confines the coldest air at high latitudes. A paper published in the Bulletin of the American Meteorological Society shows the polar vortex was weakened in the winter resulting in cold extremes in mid-latitude Eurasia. In this region, 60% of the observed cooling since 1990 can be explained by the increased frequency of weak stratospheric polar vortex states.
Impact of Volcanic Eruptions on Fluctuations of Arctic Sea Ice Extent
A paper published in the Journal of Climate shows that large volcanic forcing is necessary to explain the start of the Little Ice Age. Volcanic eruption were followed by a positive response of the Atlantic Multidecadal Overturning Circulation, followed by a centennial-scale enhancement of the Northern Hemisphere sea ice extent. Decreasing solar activity of the Maunder Minimum added to the sea ice extent and further cooled the climate during the Little Ice Age.
20th-Century Climate Change in the Central USA From Agricultural
A paper published in Geophysical Research Letters, Alter et al 2017, used regional climate model simulations and observational analysis to determine that in the central United States, the observed rainfall increase, the decrease in temperature and the increase in humidity during the summer over the 20th century is attributed mainly to agricultural intensification, with natural variability and greenhouse emissions playing secondary roles. Human activity has caused a significant long-term cooling trend (-0.35 °C between the 1940s and 2009) and higher rainfall totals via the mechanism of agricultural intensification a photosynthesis-associated increase in the air 's water vapor or humidity levels due to an explosive (400%) increase in crop production and yield since the 1940s. The author 's say the post 1940 's cooling trend conflict with the climate model simulations which project a warming trend. See more here.
Ocean Surface Temperature Variability: Large Model Data Differences
This paper compared decadal to millennial sea surface temperature variability to that simulated by global climate models. The abstract says SST [sea surface temperature] variability obtained from coral, foraminifer, and alkenone records are shown to be consistent with one another and with instrumental records in the frequency bands at which they overlap. General circulation models, however, simulate SST variability that is systematically smaller than instrumental and proxy-based estimates. Discrepancies in variability are largest at low latitudes and increase with timescale, reaching two orders of magnitude for tropical variability at millennial timescales. The authors used an Earth system model that extends over the last 1,200 years and a set of 8 CMIPS models. The models include greenhouse gas and volcanic forcings, land use changes, but only the total solar irradiance component of solar forcings. At low latitudes (30 °S ˆ’30 °N), the proxy estimates average 45 times greater variance than is associated with model SST variability at multi-centennial timescales and this discrepancy grows to more than a factor of 100 at millennial timescales. A graph of the SST variation discrepancy at various timescales is here. This indicates a major problem with the models.
Germany Electricity Prices Keep Rising
The prices of electricity in Germany are among the world 's highest largely due to the transition to highly variable wind and solar power. The price of electricity for a representative household was 28.2 Euro-cents per kWh in 2017. The price is expected to rise to 28.44 Euro-cents per kWh on January 1, 2018. By comparison, the average price of residential electricity in the USA in October 2017 was 12.84 US-cents per kWh, equivalent to 10.92 Euro-cents per kWh. The average price in Germany is 2.6 times that in the USA.