By: Albert Jacobs
CliSci # 219 2015-12-13
LOD and the AMO - a common source?
A new paper has been published as draft on the AMS (doi: 10.1175/EI-D-15-0014.1) by Steven Marcus, about the connections between the Atlantic Multidecadal Oscillation (which ties to the 60 year climate cycle) and the LOD (Length of Day, which varies slightly, inverse to the rotation speed of Earth). The LOD change is connected to orbiting and vectorial forces of the planets.
ABSTRACT:
Previous studies have shown strong negative correlation between multi-decadal signatures in length-of-day (LOD) an inverse measure of Earth 's rotational rate - and various climate indices. Mechanisms remain elusive. Climate processes are insufficient to explain observed rotational variability, leading many to hypothesize external (astronomical) forcing as a common source for observed low-frequency signatures. Here an internal source, a core-to-climate, one-way chain of causality, is hypothesized.
To test hypothesis feasibility, a recently-published, model-estimated forced component is removed from an observed data set of Northern Hemisphere (NH) surface temperatures to isolate the intrinsic component of climate variability, enhancing its comparison with LOD. To further explore the rotational connection to climate indices, the LOD-anomaly record is compared with sea-surface temperatures (SSTs) global and regional. Because climate variability is most intensely expressed in the North Atlantic sector, LOD is compared to the dominant oceanic pattern there the Atlantic Multidecadal Oscillation (AMO).
Results reveal that the LOD-related signal is more global than regional, being greater in the global SST record than in the AMO, or in global mean (land+ocean) or land-only surface temperatures. Furthermore, the strong (4-sigma) correlation of LOD with the estimated NH intrinsic component is consistent with the view proffered here, one of an internally generated, core-to-climate process imprinted on both climate and Earth 's rotational rate. While the exact mechanism is not elucidated by this study 's results, reported correlations of geomagnetic and volcanic activity with LOD offer prospects to explain observations in context of a core-to-climate chain of causality.
........ and to continue:
To which Tallbloke adds in the comments:
The amplitude of changes in LOD produced by angular momentum exchange between the Earth 's crust and the atmosphere are around 10-15% of the amplitude of the multidecadal swings in LOD which seem to be linked to the large oceanic oscillations and global temperature inflexions. Those lag behind similar periodicities and proportional changes in the disposition of solar system masses. Your inclusion of the CR count indicates the link which exists between the changing solar system mass distribution (planetary positions) and the solar cycle.[.......]Your inclusion of the SOI in the correlation points the way to an integrated understanding of these semi-annual and multi-decadal LOD variations and their relationship to global temperature via Bob Tisdale 's studies showing the cumulative nature of ENSO released energy. It 's all starting to come together.
Climate Protocols, then and now
It is interesting to look today at the
WIKI entry on the Montreal Protocol, still cheering this magnificent 1987 achievement of protecting humanity 's health from the industrial destruction of the Ozone layer, except that ..... .....
Well, it has now been clear for many years that the banning of CFCs really did not contribute to restoration of the polar ozone layer; in fact, the holes are still there; their waining and waxing have natural causes. In WUWT Tim Ball, at one time a sceptical participant in the Montreal hearings, has written a review of
the Ozone Scare as an AGW-scare dry run.
He says: "There is not now and never was a hole in the ozone. The phrase was a public relations construct to mislead and exploit fear as the basis for a political agenda. The procedure used in the exploitation of environmental and climate for a political agenda is to take normal patterns and events and present them as, or imply, they are abnormal. It works because most people don 't know what is normal. Global warming became the largest exploitation of this practice, but it was based on the knowledge gained from reported ozone depletions over Antarctica. The ozone deception served as a forerunner, a practice run, for the global warming deception to follow".
The heretical thoughts of Freeman Dyson
Dyson, a well known physics professor at Princeton, has interests in many of the natural sciences. He has recently written an essay "
Heretical thoughts about science and society" which should give you some relief from the nonsense emanating from Paris. While the last paragraph of section 1 (The need for heretics) and all of section 2 (Climate and Land Management) may be pertinent to our usual topics, I suggest you read the whole thing, because his philosophising is contagious.
[h/t Anne Debeil]
Mark Steyn in action
More Christmas entertalnment :
Dark Energy and Cosmic Expansion and Contraction
Just out in time for Christmas: The future of our Universe.
ABSTRACT:
This article proves that the photons of lower energy are annihilated into dark energy due to the destructive interference of light, and the increase of dark energy makes the universe expand, the Hubble formula could be derived based on it. The energy level of matter reduces, more and more matter becomes the dark matter in the process. The universe stops expanding and starts to contract in the action of gravity when the energy density of
radiation field becomes small enough in it.
Peiser and Lawson on COP21 deal
Not legally binding on caps and emissions.
No 'Progress': Similar to Lima accord.
CliSci # 218 2015-11-29
The Course of Solar Cycle 24
"The current predicted and observed size makes this the smallest sunspot cycle since Cycle 14, which had a maximum smoothed sunspot number V2.0 of 107.2 in February of 1906."
David Archibald writes an essay in WUWT ("A Dalton-like Amplitude for Solar Cycle 25") and shows several methodologies in order to pin down what is happening, in comparison to similar declines in solar activity (
as Timo Niroma did shortly before his untimely death in 2011). Different investigators have different starting points in their graphs, be they in the Dalton Minimum, or somewhat later, but the comparison is clear. It shows the beginning and the end of the solar Grand Maximum.
Finally, do not miss William Astley 's comments on the above WUWT linkat 6.54 am (Nov.19) and the pointed discussions with Svalgaard and Vukcevic as to the nature of solar variations.
Sighs Allan MacRae in the comments: "I blame Global warming".
David Evans ' New Science
Whence the CO2?
While most of the readers and participants in Anthony Watts' blog do not have to be convinced of the fact that CO2 does not cause CAGW, there are still enough questions around about the source(s), trends, sinks, hiding places,
residence time and relationship with temperature of the gas and its carbon isotopes to set the discussions aflame. Such occasions are not frequent, but when they occur, it becomes obvious how little we know for sure.
The exchanges may be considered academic, but are a good representation of the many pending issues still around about the functions and ways the the CO2 molecule.
And as if to underline the other side of the problem here comes the "European Commission Joint Research Centre" with a
"Report: Global growth in CO2 emissions stagnates" which states "After a decade of rapid growth in global CO
2 emissions, which increased at an average annual rate of 4%, much smaller increases were registered in 2012 (0.8%), 2013 (1.5%) and 2014 (0.5%). In 2014, when the emissions growth was almost at a standstill, the world 's economy continued to grow by 3%. The trend over the last three years thus sends an encouraging signal on the decoupling of CO
2 emissions from global economic growth. However, it is still too early to confirm a positive global trend. For instance India, with its emerging economy and large population, increased its emissions by 7.8% and became the fourth largest emitter globally."
Hey, hold your horses: These are computer generated numbers .......
The ugly facts that failed an hypothesis
There is irony in the chart that James Hansen produced in 1988 to sell the need for Kyoto. He discussed three model scenarios:
* Scenario A assumed unmitigated exponential trace gas growth,
* Scenario B assumed a reduced linear growth of trace gases,
* Scenario C assumes a rapid curtailment of trace gas emissions, such that the net climate forcing would cease to increase after 2000.
* A fourth solid line showed the observed temperature up to 1988.
CO2 content at Mauna Loa grew from 350 ppm in 1988 to near 400 ppm today, so while unmitigated Scenario A or, arguably, B should apply, the observed temperature change (as of 2013) stubbornly follows Zero Emission Increase Scenario C, which is in fact showing no influence of CO2 on temperature to speak of.
A cleaned up version of Hansen's 1988 graph, with updated observed data can be seen
HERE.
"A complete Guide to the Paris Climate Summit"
Ridley and Peiser (GWPF) give
Wall Street Journal readers (also
HERE for non-subscribers) a thoughtful overview of the Paris conference, its expectations and realities.
However, this does not deal with the truth,
disclosed recently by Christina Figueres, the Executive Secretary of the UNFCCC that "the goal of environmental activists is not to save the world from ecological calamity but to destroy capitalism" (
says Tim Ball) quoting her as saying
This is the first time in the history of mankind that we are setting ourselves the task of intentionally, within a defined period of time, to change the economic development model that has been reigning for at least 150 years, since the Industrial Revolution.
ClimateGate Redux?
Tim Ball in his
above linked article also discusses the Climategate-type cover-up involving the NOAA 's Dr Tom Karl et al paper in Science (June 2015) about the way they made the "hiatus" disappear just in time for COP21. Sceptics (including
Ross McKitrick) protested loudly about the methods used and eventually the Chair of a US Congress Committee had to ask NOAA three times for the data relative to NOAA altering "historical climate data", eventually issuing a subpoena. It appears NOAA does not intend to release their "internal communications".
Meanwhile, the IPCC is making hay with the presumed disappearance of the Pause.
Nairobi, 28 November 2015
Nairobi, 28 November 2015 - Founding Executive Director of the UN Environment Programme (UNEP) Maurice Strong passed away at age 86 -
CliSci # 217 2015-11-15
The next Global Cooling
The
Sunday Express reports on a presentation at the National Astronomy Meeting in Wales by Professor Valentina Zharkova (Northumbria U.) where she makes the case, on behalf of a European team of researchers, for a coming major cooling period. It being a newspaper report on a verbal astrophysics presentation, it 's a bit confusing, so it is better to take a step back to an actually published paper.
Her presentation probably builds on work she published in 2014 with Simon Shepherd, (see last item CliSci # 208), and her own paper two years earlier.
It runs parallel to work by deJager and Duhau, mentioned in these pages repeatedly, whereby the phase behaviour of the two solar dynamo expressions are explored in terms of total solar intensity. Their point is probably best made in Figure 1 of the pay-walled Shepherd paper which graphs I am hereby making
available from my Dropbox . The top diagram shows the solar spectral analyses of the SBMF (Solar background magnetic field), which means to represent the slightly out-of-phase toroidal and poloidal fields separately, over the last four and coming two Solar Cycles. The bottom diagram shows the combined effect. Note how this total solar magnetic effect (width between the dashed lines) is greatest during the nineteen eighties and nineties and reaches a minimum by 2040.
Says the Shepherd paper: "The variations of the modulus summary of the two [Principal Components] in SBMF reveals a remarkable resemblance to the average number of sunspots in cycles 21 24 and to predictions of reduced sunspot numbers compared to cycle 24: 80% in cycle 25 and 40% in cycle 26". Zharkova was not that timid. At the Wales meeting, she said, reportedly: "We predict that this will lead to the properties of a "Maunder Minimum." IPCC should pay attention.
NH Ice/Snow cover explodes
The warmists who consider the Arctic the "canary in the coal mine" are remarkably silent.
Luni-Solar Tides and Global Temperature Anomalies
On his blog Astro-Climate-connection, Ian Wilson has published a two part article that speculates about the connection between lunar-solar tidal rhythms and some temperature variations that can not be explained by solar influence alone.
The paper supports the claim that the onset of the ENSO climate phenomenon was being primarily driven by variations in the long-term luni-solar tidal cycles. This leads to the possibility that variations in the luni-solar tides are responsible for the observed variations in the historical world monthly temperature anomaly data.
About losing your atmosphere
NASA's Mars Atmosphere and Volatile Evolution (MAVEN) mission has identified the process that appears to have played a key role in the transition of the Martian climate from an early, warm and wet environment that might have supported surface life to the cold, arid planet Mars is today.
MAVEN measurements indicate that the solar wind erosion strips away gas at a rate of about 100 grams every second. "[It] is an important mechanism for atmospheric loss, and was important enough to account for significant change in the Martian climate," said Joe Grebowsky, MAVEN project scientist from NASA's Goddard Space Flight Center.
Inconvenient Historical Facts
In 1971 NASA and NCAR Climatologists S. I. Rasool and Stephen. H. Schneider published a paper in Science : "Atmospheric Carbon Dioxide and Aerosols: Effects of Large Increases on Global Climate" (Science 173, 138 141) which concluded: "However, it is projected that man's potential to pollute will increase 6 to 8-fold in the next 50 years. If this increased rate of injection... should raise the present background opacity by a factor of 4, our calculations suggest a decrease in global temperature by as much as 3.5 °C. Such a large decrease in the average temperature of Earth, sustained over a period of few years, is believed to be sufficient to trigger an ice age. However, by that time, nuclear power may have largely replaced fossil fuels as a means of energy production." This was the seventies, the period of Snowball Earth predictions.
Note that this cooling dealt with aerosol pollutants, not CO2. Any warming caused by CO2 was considered to be minor.
This followed the …ngstr ¶m lab 's discovery (in the days Arrhenius developed "Global Warming" though CO2), that traces of CO2 soon saturated the absorption spectrum and that increased amounts of CO2 made little difference in further warming.
Stephen Schneider went on to be a main mover in AGW and Coordinating Lead Author of WG II in the IPCC 's AR4, ("A Super star of the Greenhouse", John Daly called him). Schneider famously said: " So we have to offer up scary scenarios, make simplified, dramatic statements, and make little mention of any doubts we might have. This double ethical bind that we frequently find ourselves in cannot be solved by any formula. Each of us has to decide what the right balance is between being effective and being honest. I hope that means being both. '
Schneider died in 2010, aged 65.
Ian Plimer 's new book
After his near encyclopaedic 500 page
Heaven and Earth, Professor Ian Plimer has followed up with
Heaven + Hell which takes aim at the Pope 's Encyclical and the sources of "Junk Science promoted by the Vatican", as
this review says. It 's at Amazon.
CliSci # 216 2015-11-01
Are mass extinctions cyclic?
Geologist Michael Rampino and ecologist Ken Caldeira report in the Monthly Notices of the Royal Astronomical Society that they have made some headway in the thirty year argument about the connection between mass extinctions and impacts.
"The correlation between the formation of these impacts and extinction events over the past 260 million years is striking and suggests a cause-and-effect relationship," says Rampino.
Specifically, he and Caldeira found that six mass extinctions of life during the studied period correlate with times of enhanced impact cratering on Earth. They show a cyclical pattern over the studied period, with both impact craters and extinction events taking place every 26 million years.
This cycle has been linked to periodic motion of the sun and planets through the dense mid-plane of our galaxy. Scientists have theorized that gravitational perturbations of the distant Oort comet cloud that surrounds the sun lead to periodic comet showers in the inner solar system, where some comets strike the Earth.
Read more at:
http://phys.org/news/2015-10-scientists-link-comet-asteroid-showers.html#jCp
This cycle has been linked to periodic motion of the sun and planets through the dense mid-plane of our galaxy. Scientists have theorized that gravitational perturbations of the distant Oort comet cloud that surrounds the sun lead to periodic comet showers in the inner solar system, where some comets strike the Earth.
A similar effect has been
described by Nir Shaviv with respect to variation in galactic cosmic ray intensity, when the solar system passes through one of the galaxy 's spiral arms, about every 135 my (GSA Today, July 2003)
Cart before the horse
While the oceans are often credited with being an important medium that acts as the transmitter of heat to the atmosphere, and instrumental in climate changes of the past, even by shortcutting the AMOC 's overturning to Portugal 's latitude, others are pointing to the wind gyre effect of the AMO or more specifically at atmospheric influences on the ocean. Miami University Professor Amy Clement has been putting her computers to work and tested whether the oceans really move the climate.
As
Science Daily reports from the Science, 2015 350 (6258) article:
"While the overall rise in average temperature of the Atlantic is caused by greenhouse gases, this study examines the fluctuations occurring within this human-related trend. Identifying the main driver of the AMO is critical to help predict the overall warming of the North Atlantic Ocean in coming decades from both natural and human-made climate change. Recent research suggests that an AMO warm phase has been in effect since the mid-1990s, which has caused changes in rainfall in the southeastern US, and resulted in twice as many tropical storms becoming hurricanes than during cool phases.
Using multiple climate models from around the world, Clement's research team removed the ocean circulation from the analysis to reveal that variations in the Atlantic climate were generally the same. The AMO results in a horseshoe-shaped pattern of ocean surface temperatures in the North Atlantic Ocean that have been naturally occurring for the last 1000 years on timescales of 60-80 years. This new analysis shows that the pattern of the AMO can be accounted for by atmospheric circulation alone, without any role for the ocean circulation."
This retrograde paper has the courage to mention the 1000 year historic 60-80 natural cycle, but then fails to explain the connection with the precept at the beginning of the above quote (top para 2). And what causes "the fluctuations occurring within this human-related [greenhouse] trend"?
No Amy, It 's the sun. You must have seen
this one some time ago?
Tim Ball and the Greenhouse - Part III
He traces the IPCC 's shameful political handling of the water vapour issue, because it could not be tied to direct anthropogenic influence and was therefore conveniently relegated to the malleable "feedbacks" to the CO2 effect.
Arctic getting colder?
Ice thickness and ice-cover extent have always been closely monitored indicators as witnesses of global warming, particularly since the advent of the satellite. It is often said that the Arctic is like the canary in the coal mine.
Until we decide why the Arctic should be such a proxy for the entire globe (and the answer is probably an extra-terrestrial one) we should be careful, lest the "proxy" bites us in the bum.
"Has anyone been wondering why we 've been hearing so little about the Arctic lately? It turns out that the Arctic is far less ice free than many thought or expected just some years ago. So wrong can the models be. More Arctic ice and up to 1.5 °C colder! The new study finds that in 2014 more ice survived the summer as MYI than in the nine most recent years and it was only slightly less than during 1968 2015 on average . Also between November 2014 and April 2015, winter air temperatures were between ˆ’0.5 °C and ˆ’1.5 °C colder than during 1980 2010.
This "new" information is contained in
Haas & Howell 's GRL paper "
Ice thickness in their Northwest Passage" which indicates there is nothing new under the sun.
As for Antarctica, NASA/Goddard's research challenges the conclusions of studies, including those of the IPCC 2013 report, which say that Antarctica is overall losing land ice.
A new NASA study says that an increase in Antarctic snow accumulation that began 10,000 years ago is currently adding enough ice to the continent to outweigh the increased losses from its thinning glaciers.
The History of Modelling
Derek Alker has published on the so-called "slayer 's" PSI site a draft/discussion version of his paper called "
The modelling history of Climatology" in which he not only traces an interesting piece of history that goes back to the 1940 's, but also notes where the process went off the rails, mostly in the treatment of H2O in the atmosphere. Much faith is put in Miskolczi, Gerlich & Tscheuschner and Nahle.
Call this "Pal preview". It works at least as well as peer review.
Some discussion has started in the Yahoo ClimateSceptics Forum, where wagging fingers are cautioning that CO2 is not the prime climate driver anyway; that 's all right to a point, as the IPCC models don 't include solar system effects in any serious way. Also, the paper does not appear to deal with the models ' failure to include "
Principal non-linear dynamic modes of climate variablilty", which is the title of a new
Nature article by Mukhin, Gavrilov, Feigin, Loskutov and Kurths [open access].
Amino acids on Mars
A team of NASA-funded scientists has solved an enduring mystery from the Apollo missions to the moon -- the origin of organic matter found in lunar samples returned to Earth. Samples of the lunar soil brought back by the Apollo astronauts contain low levels of organic matter in the form of amino acids. Certain amino acids are the building blocks of proteins, essential molecules used by life to build structures like hair and skin and to regulate chemical reactions.
There is a good explanation on the above hyperlinked
Science Daily report on the original article in
Geochimica et Cosmochimica Acta 2016; 172: 357 DOI:
10.1016/j.gca.2015.10.008
Death of the Sun
Here 's the abstract:
The sun is already four and a half billion years old and will eventually be 10 billion years old. This note is about the last 100 million years, much less than one percent of the total age of the sun.
For the major part of its life, the sun radiated as a result of the conversion ("fusion") of hydrogen into atomic nuclei of helium. But eventually, the hydrogen will run out, no energy is produced and the centre of the sun collapses. This makes it hotter and therefore the exterior is inflated: the sun is now a giant star. Eventually, the temperature in the centre becomes so high - many hundreds of millions of degrees - that nuclear fusion reoccurs; the formed helium can be converted to carbon and in oxygen. That again creates a source of energy.
In the extremely unstable sun where hot gas masses ascend and cold gases descend, thermal pulses may occur; these are brief bursts of energy. In that phase - and even later - the sun can become a Mira star. This is a type of variable star that can be a hundred to ten thousand times brighter or weaker in several hundred days. They are named for Mira Ceti, the binary pulsing red star.
Finally, all nuclear fuel is depleted; the sun collapses into a so-called white dwarf, which is surrounded by a large gas cloud of light years in diameter: a planetary nebula. The planetary nebula phase lasts no more than 100,000 years; then, the nebula has also disappeared. What is left are the remains of a white dwarf that slowly cools and - after many billions of years - is no longer visible.
CliSci # 215 2015-10-18
About Methane, Cows and Other Fictions
Dr Tim Ball takes the cow by the horns and reviews the entirety of claims about the relevance of CH4 as a GHG, real or imagined, in this
essay in WattsUpWithThat .
About carbon-dioxide, measurements and hypotheses
He goes back to the work of the late George Beck and Zbigniev Jaworowski and rekindles an old argument that brings out some heavy hitters in the comments.
"A perspective on uncertainty and climate science"
There are a number of ways of attack on the myths of the climate issue, depending on the target audience.
I believe that for an intelligent, but not necessarily scientific audience the cumulative (un)certainty aspects of the IPCC 's method of inquiry are key to the rejection of its hypothesis. We 're talking about basic data, their acquisition, about proxies and models etc.
Presentations on scientific controversies themselves make little measurable lasting impact on a general, yet intelligent audience and should be avoided.
So, first of all, the audience must understand the principles of the rigour of the "scientific method".
Arons ' 1997 touchstone, as quoted by Arthur R ¶rsch,
How do we know . . . ?
Why do we believe . . . ?
What is the evidence for . . . ?
still lies at the base of proper scientific inquiry and should probably be explained to such an audience as being
conditio sine qua non for those politicians who move from WG I to the impact and abatement stages of II and III. The IPCC process fails that test miserably.
The questions are really:
1. Should the "conclusions" with their probability codicils, as built on the quicksand of WG I be accepted as a proper basis for worldwide expenditures in the trillions of dollars?
2. Should it be allowed to consider - and treat - these expenditures as dealing with a social problem, rather than a scientific one? Sounds like a Bait-and-Switch fraud to me.
A solar signal in tropical tropospheric water vapour?
Concentrations of Water Vapour in the tropical troposphere strongly influence surface climate as the most important "greenhouse gas". These concentrations seem to be (anti-)correlative with the solar cycle, with a two year time lag.
ABSTRACT:
A merged time series of stratospheric water vapour between 30 º S and 60 º N and 15 to 30 km and covering the years 1992 to 2012 was analysed by multivariate linear regression, including an 11-year solar cycle proxy.
Lower stratospheric water vapour was found to reveal a phase-shifted anti-correlation with the solar cycle, with lowest water vapour after solar maximum.
The phase shift is composed of an inherent constant time lag of about two years and a second component following the stratospheric age of air.
The amplitudes of the water vapour response are largest close to the tropical tropopause (up to 0.35 ppmv) and decrease with altitude and latitude. Including the solar cycle proxy in the regression results in linear trends of water vapour being negative over the full altitude/latitude range, while without the solar proxy, positive water vapour trends in the lower stratosphere were found.
We conclude from these results that a solar signal seems to be generated at the tropical tropopause which is most likely imprinted on the stratospheric water vapour abundances and transported to higher altitudes and latitudes via the Brewer Dobson circulation.
Hence it is concluded that the tropical tropopause temperature at the final dehydration point of air may also be governed to some degree by the solar cycle. The negative water vapour trends obtained when considering the solar cycle impact on water vapour abundances can possibly solve the water vapour conundrum of increasing stratospheric water vapour abundances despite constant or even decreasing tropopause temperatures.
.....and in summer floods in Switzerland?
* In support of a critic of IPCC ideology
The well-known national French TV Weatherman, Philippe Verdier has published a "non-conformist" book about climate, criticising the IPCC. He is apparently being told to repent or face being fired. He criticises the stance of French Foreign Minister Laurent Fabius, who will be President of the Paris COP 21 Conference.
A petition has been started in France and we are being asked to support it.
I recommend that you do, in the cause of free expression and against censorship and intimidation.
Please sign the petition . After publication on some US sites it has caught fire. At this time of writing it has gone world-wide.
The ways of a dedicated ecologist
Dr Patrick Moore 's history as an environmental idealist from the protest days of nuclear testing in the Pacific and as a GreenPeace founder is well known. Then, GreenPeace changed and Patrick Moore got out.
Today, back to ecology, he sings the glories of CO2 as a life-giving substance and traces its importance since the beginning of life on earth in biological and geological terms, through the climates of time.
Reading it would be time well spent.
CliSci # 214 2015-10-04
Dissecting the IPCC 's model architecture
Dr David Evans is an Australian mathematician/engineer who is considered to be an expert in modelling. He is also the husband of Joanne Nova, who runs one of the best blogs in the climate-sceptical blogosphere.
During the past three years Evans has worked on turning the IPCC's models inside out and found the inner core of the IPCC 's CO2-based model architecture wanting. While others may have found the models wanting for a number of other reasons, it is important to fight the battle on the warmists' own terms.
His work is contained in a series of nine articles, published between September 22nd and October 4th, which can be found on the joannenova website, starting with the most recent one:
In the first sections he discusses how the IPCC 's Conventional Basic Model works.
Then, his criticism ranges from the use of partial derivatives of dependent variables, to the way all feedbacks seem to have to work through to the surface temperature and the fact that all radiation imbalances are treated the same, whether they are in the sky or on the ground.
Greenland and the cold blob
"Blobs" are in fashion these days. For months we have been entertained with the progress of the unexpected warm blob in the North Pacific which influenced weather patterns in Pacific coastal areas of North America and which by now seems to have morphed into a more Southerly Ni ±o, at least in the press reports.
The Nin µs generally originate by heating in the Philippine/Polynesia area and their volume expansion is held back by equatorial currents until it overpowers them.
Now we have a re-awakening of the cold blob in the North Atlantic. It has nothing in common with its Pacific counterpart as it is thought to be related to the amount of melt water emanating from the Greenland ice sheet.
There is little doubt about the influence of cold fresh water on the North Atlantic circulation pattern, as the salt-laden "Gulf Stream" sinks to the bottom and returns southwards, the so-called AMOC overturning process. Climate reversals of the Holocene past have been tied to this process which cools the Northern Hemisphere by melting of the Greenland ice pack.
Warmists like Rahmstorf quote this as one of the hazards of CAGW. But Rahmstorf's favourite GHG solution has nothing to do with it.
How much is the Greenland ice pack contributing to that fresh water? It's worthwhile to take a look at the official measurements of its ice budget as provided by
the Danish Meteorological Institute. It shows the surface mass balance today and over the past 25 years.
Melt water and calving are as natural to such an ice mass as the addition of new snow at its top.
Cooling is taking place. The Greenland ice sheet gained 200 gigatons over 2014/15 and started melting this past summer two months later than usual, he writes. And it is all tied to the solar cycle.
Comparisons are made to the Dansgaard-Oescher cycles and Heinrich events.
ClimateGate, Six years later
The release of a first selected batch of leaked (?) e-mails between the IPCC 's CRU researchers and their colleagues made an important contribution to the failure of the COP Copenhagen meeting in 2009. Here we are, six years later, with the warmist community gearing up for a do-or-die frantic effort at COP 21 in Paris. Meanwhile there are still untold e-mails waiting to be released from the cache. There is "The Need To Revisit The Climategate Revelations To Counter Mainstream Media Failure And The Paris Climate Conference Plans" according to Tim Ball, who wrote
a post in WUWT, which updates us on what has been and is happening behind the curtains.
There is a worthwhile anthology of choice CG items as well as a purported letter from Mr. FOIA who holds the key Password to CG3, the third release. It is not often that we can offer you a detective story to read.
Exploring non-linear climate change causes
In the Copernicus series "Non-linear Processes in Geophysics" a discussion paper by Hyderabad-based researchers Lakshmi and Tiwari has appeared. It looks at
Imprints of Solar-ENSO-Geomagnetic Activity on the Indian climate over the past 125 years, using tree ring records from the Western Himalaya, ENSO records, the geomagnetic "aa index" and the Sunspot number.
What sets this study apart is its methodology, based on Singular Spectral Analysis and Wavelet Analysis, which leads to the extraction of non-linear cyclic patterns that portray the influence of solar magnetic behaviour on Indian climate.
One conclusion: "The present analysis thus suggests that the influence of solar processes on Indian temperature variability operates in part indirectly through ENSO, but on more than one time scale. The analyses hence provides credible evidence for teleconnections of tropical Pacific climatic variability with Indian
climate ranging from interannual-decadal time scales and also demonstrate the possible role of exogenic triggering in reorganizing the global earth ocean atmospheric systems."
This 30-page paper is pretty heavy slogging for non-physicists, but please read the Abstract, Intro and Conclusions (with a peak at the illustrations) and you will appreciate how deficient the IPCC is by ignoring the non-linear natural processes that affect us. If we ever are to disentangle the causes of changes in our climate system, it may well have to come out of efforts like this, as well as the effects of the orbital forces of the solar system, none of them linear.
(h/t H.Masson)
Climate Change at the Paleozoic/Mesozoic boundary
A special for my geology colleagues
Major planetary upheavals have always been recognized in the geologic record; many breaks, changes in overall climate, marine and land fossils mark the boundaries of the great geologic subdivisions. It is therefore ironic that one of the most important boundaries, the one between Palaeozoic and Mesozoic, should have caused such persistent trouble and disagreement over the years.
Nominally the break occurs at the top of the Permian/base of the Triassic. It is of climatological importance because of the large changes of lithology of deposits (landscape) and breaks in the palaeontology. It is expressed by aridification (e.g. Zechstein salt) in Western Europe, and by the immense Siberian traps lava flows farther East. On the well known Scorcese/Berner graphic of 600m years of temperature and CO2, it is noted for a recovery from the lowest values ever, when the Carboniferous glaciation of Gondwana land gave way to the clastics of the Permian/Triassic Karoo supergroup, some 270m years ago. The end of the Permian is then marked by general extinctions and turnover in terrestrial ecosystems, which in a recent GSA paper are called "the greatest ecological catastrophe in Earth history" by Robert Gastaldo and six co-authors in
GSA's "Geology" V.43 #10, (free download) who have trying to determine where the system boundary actually lies.
South Africa's Karoo basin has one of the few relatively undisturbed geological sequences of this period, but the Permo-Triassic boundary is hidden and controversial, as described by the authors, who find a 20 million year gap between the marine extinctions and the terrestrial ones, all within a monotonous clastic series of the "Karoo Supergroup", They pick it at 251 million years ago, but are left with a number of controversial indicators, both paleontological and paleo-magnetic.
This all happened at a time that plate movements were starting to accelerate; gaps in the geologic succession are worldwide, geologic unconformities are legio and the opening of the South Atlantic started around this time.
___________________________________________________________________________________________________________________________________________________________________________________________________
CliSci # 213 2015-09-20
A plasma tornado on the sun
NASA 's Solar Dynamics Observatory recorded an almost 3 million degree Celsius plasma tornado on the sun which is said to contain in part iron particles. While this is not a rare event - iron being the midpoint between nuclear fusion and fission processes - it results on
WUWT in heated discussion between those solar scientists who see solar events affecting earth climate (Astley, Vukcevic) and those who don 't (led by Svalgaard) and ranging from the Big Bang to Dark Matter and the Infinite Universe.
As with all these blogs, spread over the globe 's time zones, the going gets good about halfway through the comments.
Solar cause is gaining attention
Much of it is found in two summary papers by Douglas and Knox, entitled The sun is the climate pacemaker pt 1 & 2. These pay-walled papers can be downloaded as "article in press" from:
In addition there are
- an article by
Maliniemi et al in JGR on distribution of NH winter temperatures during over a solar cycle, and
- a
discussion by Scafetta of a paper by Gil-Alana et al, whereby the authors claimed solar activity fluctuations had no impact on climate. However there is indeed a relationship that is in fact more complex than that assumed by Gil-Alana and colleagues.
The Insanity Of Wasting Time and Money On More Climate Models
In an essay in WUWT,
Tim Ball takes another run at the uselessness of computer climate models, stating that "The reality is the models don 't work and can 't work for many reasons, including the most fundamental: lack of data, lack of knowledge of major mechanisms, lack of knowledge of basic physical processes, lack of ability to represent physical mechanisms like turbulence in mathematical form, and lack of computer capacity. Bob Tisdale summarized the problems in his 2013 book Climate Models Fail. It is time to stop wasting time and money and put people and computers to more important uses."
The essay also
quotes Joanne Nova on her cost estimate of $ 79 billion by the US government alone, updated by a
Eureferendum post to at least $ 100 billion for all Annex 1 countries.
What is worse is that the GCMs have universally failed to make reliable predictions.
Tim Ball analyses the reasons why and urges an end to the futile exercise.
More on computer simulations
"Anyone who claims that a computer game simulation of an effectively infinitely large open-ended non-linear feedback-driven (where we don 't know all the feedbacks, and even the ones we do know, we are unsure of the signs of some critical ones) chaotic system hence subject to inter alia extreme sensitivity to initial conditions is capable of making meaningful predictions over any significant time period is either a charlatan or a computer salesman.
Ironically, the first person to point this out was Edward Lorenz a climate scientist.
You can add as much computing power as you like, the result is purely to produce the wrong answer faster.
So the fact that they DO appear to give relatively consistent answers albeit entirely incorrect ones is evidence that someone is extracting the urine."
(h/t HMasson)
On reworking the statistics
There is - of course - no end to finding discrepancies due to temperature data manipulations, be it land-based or ocean-based (as was Karl 's paper - CliSci # 205, Mobilising for Paris" - June 10th).
However, even the UK Met apparently agrees that the two Lower Troposphere satellite time series are more reliable.
But look at
David Whitehouse 's GWPF report on the UK Met 's communications and see how conflicted they are, resp. the Met 's Head of Climate Prediction, Dr Vicky Pope and the report presented by Dame Julia Slingo.
Where is the sense of reality in all this nonsense? Whether one talks about ocean temperatures, sea levels or land temperature data, the anomalies in dispute are less than applied corrections, adjustments and error bands.
* Submission to Canadian Government and Alberta Climate Panel
Two important political events are taking place this fall: the UNFCCC 's COP21 in Paris and the new Alberta Government 's Climate Change Advisory Panel. While both bodies will concentrate more on impact and mitigation/abatement than on the quicksand base of the presumed CO2 cause of any climate change, the Friends of Science Society has seen it as its duty to point out forcefully that there is no valid basis for the "carbon" reduction programs of these government bodies, and that these programs will do great damage to economies around the world without any measurable benefit.
This Friends of Science document was prepare for the Canadian Federal Government, and copied to the Alberta's Climate Change Advisory Panel. The IPCC reported in 2013 that a naturally induced 15 years hiatus in global warming (now 18 years and 8 months) began before Kyoto was ever ratified. This evidence conflicts with the hypothesis of Anthropogenic Global Warming/Climate Change of carbon dioxide as the driver of warming. Carbon dioxide emissions from human activity have risen some 35% in the past 20 years despite measures said to reduce carbon emissions. Numerous unintended consequences of climate action have crippled national economies and pushed taxpayers into heat-or-eat poverty. Climate change targets could devastate the Canadian economy, especially if legally binding. It is time to clear the air.
Black Swans
This
essay by Dr. Gerrit J. van der Lingen describes the politics and the abusive philosophy of science as practised by the United Nations Intergovernmental Panel on Climate Change and its creations. The UN is using climate change as a tool to change the economic development model that has been reigning for at least 150 years since the Industrial Revolution. The UN's real agenda is concentrated political authority. The theory of catastrophic man-made global warming has been falsified several times, but these falsifications have been totally ignored. It was once thought that All swans are white until a black swan was discovered.
Our friend Gerrit is a retired geologist in New Zealand who has also published on climate matters, in particular Sea Level change. The English version of his essay is lodged on the FoS website.
CliSci # 212 2015-09-06
Messing with the Sea Level record
In a new publication "
NASA Science zeroes in on Ocean Rise" takes another kick at the Sea Level cat in an attempt to keep the momentum for COP21 going. "At least three feet and probably more", possibly within a century, says Steve Nerem, the Leader of the Sea Level Change Team, "or somewhat longer".
Somewhat longer indeed, if at all.
Now, that's 900 mm in 100 years, which is 9 mm/yr.
When is this linear projection nonsense going to stop?
NASA had reported earlier that SL had risen 3 inches since 1992 (3.5 mm/yr) and much is now made of glaciers melting at an accelerating rate because of the disastrously increasing Global Warming.
The "measurements" are all satellite derived, a method which has not been verified against long established onshore gauge stations in stable continental areas. These stations are showing long time averages of ~ 1.8 mm/yr, which reflects the
decreasing rate of SL rise of the last six thousands years, after the much larger rate of the Post-glacial Holocene transgression 14,000 years ago. See the
comments and graphs in WUWT.
While you are on WUWT, scroll down to the comments by "D.I." on 28/8 at 4:17pm for a quick and light-hearted three minute video explanation about what Sea Level is in terms of the geodetics of the globe; when you see what the SL satellites supporters have to correct for, you wonder how they dare to speak about millimetres.
German meteorologist Puls used to be a IPCC supporter until he started to check some of their claims, ten years ago. He has been an active member of the EIKE sceptic group ever since.
Proxies, real or imagined
Much of paleo-climatology, indeed, much of climatology itself, hangs together with proxies, that serve as parameters for simulations by computer modelling. In particular, temperatures of the past, atmospheric and oceanic, are of prime interest in reconstructing the nature of past climate changes, but what evidence do we have?
Evidence from geologic mapping may give us a clear understanding of the historic distribution of land and sea deposits, telling deserts sands from ocean beaches, and glacial deposits from coal formed in tropical jungles. It also supplies a record of tectonic upheavals throughout geologic time. These are usually changes of a very large scale.
So far, so good, but not good enough for the strictly historic scale of the past 1000 or so years. There are good proxies and bad proxies and partially inadequate proxies. The much celebrated tree ring proxy for temperature is actually a much better proxy for humidity (precipitation) and habitat. Sunspots, the most obvious measure of solar activity, do not take account of the Coronal Mass Ejections (which have a different particle make-up and a stronger UV frequency radiation). Solar cycle length is more indicative of solar activity than sunspot numbers. Ice cores have their own problems of compaction and migration of inclusions.
A paper (
doi: 10.1073/pnas.1501568112 PNAS August 17, 2015 - [$]) by Ingalls
et al shows that a previously embraced (Qin et al 2014) unicellular marine Archea algae (a prokariot form of life still present today) give vastly erroneous readings on ancient ocean temperatures.
What is actually more interesting is that it results in a lively
discussion in WUWT on proxies-in-general.
The hot Corona
The Sun 's Corona reverses the temperature decline from the nuclear fusion core to the outer layers, so that the visible lower photosphere surface is "cooler" than any of them. But then, the Corona (which one could compare to the position of the earth's atmosphere) is hundreds of times hotter than the photosphere through a process by which magnetic waves are converted into heat energy. How that is done has become more clear after two recent NASA missions and from work by two Japan-based researchers, published in The Astrophysical Journal.
More detail is
HERE and
HERE as well as explanations and discussions on
Tallbloke 's blog , a "go to" blog for solar system discussions.
Cosmic Rays, Clouds and Climate
Nothing particularly new, but a nice package that could serve as an introduction.
NH temperatures and the Sun
The authors compare and integrate a number of different temperature data sets from the past centuries and finally match them with
Scafetta and Willson's 2014 update of the original Hoyt and Schatten 's data set from the nineties.
A strong correlation is found between these two datasets, implying that solar variability has been the dominant influence on Northern Hemisphere temperature trends since at least 1881.
They conclude: "We discuss the significance of this apparent correlation, and its implications for previous studies which have instead suggested that increasing atmospheric carbon dioxide has been the dominant influence".
No wonder Willie has become persona non grata.
CliSci # 211 2015-08-23
Ozone, the Sun and Climate
Early this year Joanne Nova's blog posed the question "Is the Sun driving Ozone and changing the Climate?" as a follow-up to Stephen Wilde's 2011 paper "How The Sun Could Control Earth 's Temperature".In Wilde 's paper the solar activity is held to be instrumental in moving the Polar Jet Streams and affecting the amount of solar energy directed into the oceans. Now Steven Capozolla proposes a way in which this would happen in "Is Ozone Recovery Warming the Stratosphere And Adding Credence to Solar Variability?"The ozone question is replete with stories about the Montreal Protocol (a test case for Kyoto), the commercial interests of Dupont and CFCs and the usual scare stories, which have since been put to rest. But the exact mechanism of the solar influence through Ozone creation is still hotly being debated in the comments following Capozolla's piece in WUWT.
Following "The Blob"
The Pacific is a big place. Old seafarers used to call it "The Quiet Ocean". Present day science does not find it so quiet at all. ENSO events (El Ni ±o/La Ni ±a) dominate the equatorial and Southern parts. Heating in the Western Pacific near the Philippines and NewGuinea increases sea levels locally, held in place by the Equatorial Current until the warm pool burst through on its way to the coast of South America, causing turbulences and upwellings.Usually not much is heard of what happens in the Northern Pacific, but the "North Pacific Hotspot" plays its own part in the circulation in the northern latitudes. Again it seems to be the Western Pacific between Taiwan and Borneo where the heating occurs, but it is the counterclockwise current coming from the Gulf of Alaska which forces the Northern part of this pool Eastward. We discussed this feature in three items in CliSci of June 30th (# 207)After several attempts to cross the Pacific, the Warm Pool's effects have now installed themselves in the NE Pacific, off the costs of Alaska and British Columbia and is being blamed for the hot and dry weather in the US Pacific coastal states.Bob Tisdale gives an update in WUWT
With AGITPROP on the Road to Paris
Joanne Nova is upset about how the mass media are being taken in by the wave of disinformation. She writes:"NOAA has a press release out being picked up around the world. For example, the DailyMail, UK, is saying July was the hottest month since records began in 1880 as heatwaves swept the Earth 's countries and oceans. Other silly tabloids have headlines about this being the hottest July in 4,000 years, as if we have even the remotest idea what the average July global temperature was in the days of Plato.Better data shows July this year is the hottest since way back in 2014. It 's not 4,000 years, not 135 years, it 's the hottest July since the last one.We only have 30 years of good climate data: the satellites tell us the pause is real, and last month 's summer temperatures is not a record anything. According to the UAH and RSS global satellites, lower troposphere averages for July 2014 were 0.30C and 0.34C, compared to July 2015 of 0.28C. Even, June 2015 was hotter (UAH, 0.35C; RSS, 0.39C).July 2015 is not even the hottest month since June."As I am writing this on Friday afternoon in August, the outside temperature in Calgary is 3 „ƒ. Wonderful records, those local surface temperatures.
Synchronies of the 60-year Cycle
Our Argentinian colleague Eduardo Ferreyra came across a 2009 comment by John M. Quinn, a geophysicist who used to work for the US Naval Oceanographic Office and NOAA and who also has written a book (2010) Global Warming: Geophysical Counterpoints to the Enhanced Greenhouse Theory (review).
Quinn makes the following point:"[........] One finds on the secular time scale that both of the X- and Y- component temporal, annual-means profiles of the Earth 's Orientation mimic exactly the Global Temperature Anomaly (GTA) annual means profile. On the decade time scale one finds that the GTA mimics the Geomagnetic Dipole variations and the variations in the Earths Anomalous Rotation Rate [i.e., Excess Length of Day (ELOD) Annual Means]. The Dipole Field, the GTA and the ELOD all have a 60 year period on the decade time scale. There are many other such correlations on both time scales.[........]".
Limits of Wikipedia
The Encyclopedia Britannica is standing virtually unused in my bookcase. Not only has research moved on-line, but a new Encyclopedia of the fruits of the brains of humanity is being jostled about by the interpretations provided by its readers. The accessibility aspect of such a move to a worldwide encyclopedia online can only be welcomed, but some subjects have become the victims of objectionable manipulation. In the case of descriptive non-controversial subject matter, WIKI poses no great problem, but when dealing with science, and specially controversial science and its practitioners WIKI 's reporting can be quite incomplete and one-sided. It is also subject to being influenced by unprofessional sources with an axe to grind.
Obviously, Climate Science is such a subject. There was a time some years ago, that there was a correction battle going on at Wiki. One contributor would state an interpretation, which would be promptly deleted and replaced by an other. It could go back and forth for days. A poor excuse for science discussion. Much of this was laid at the feet of the notorious William Connoley.
Organisations have also fared badly. The Friends of Science Society, as a non-profit group of mostly retired independent professionals, was politically opposing the Kyoto Protocol on scientific grounds and was beleaguered by mud-diggers/slingers like SourceWatch and DeSmogBlog. There was much money behind the latter; they managed to get a double spread in the Globe&Mail (2006) which attempted to be a character assassination of one of the FoS' advisors and general allegations of oil money and shady tax deals purportedly done by the organisation itself.
Although the allegations could easily be answered - and were - the WIKI page on the Friends of Science Society is still depending on that false information more than any other source and is decidedly unfriendly. It seems that it is beyond the comprehension of the editors that anyone would have minority views opposing a politically correct scientific interpretation for the love of Science and without personally benefitting from it financially.
Voices are being heard today warning that Wikipedia can not be trusted on controversial subjects. The latest is an article by Drs Likens and Wilson, published in PLOS ONE which is being discussed in Phys.org/news, in
Zeenews.india, in
WUWT and particularly by Delingpole in the
The Daily Telegraph. You can even get a
"No Wikipedia" logo for your email.....
(h/t LDelory)
.........And
watch the Peer Review battle as well: Springer, the giant UK/German science publishing firm, has announced it has withdrawn 64 papers from ten of its hundreds of journals because of fake reviews and fake e-mail addresses. Most of those so far disclosed are medical papers by Chinese authors. Didn 't even talk about Pal Review yet.
Alberta 's "Climate Leadership Discussions"
The new NDP government in our province (for outsiders: soft socialist) aims to "improve" on their predecessor 's lukewarm green performance by obtaining sanction from citizens to implement Ontario and Quebec type priorities and policies which have ruined provincial economies.
It has a dedicated website: <
http://alberta.ca/climate-leadership.cfm> that contains a "Climate Leadership Document" and an online citizen survey <
https://climateleadershipsurvey.alberta.ca/>. I urge all of you to take part in this relatively short survey. There are two opportunities within the Q&A survey in which you can contribute opinions, one short one and a final one which allows 1000 words. Please do so. If we don 't react, no one else will!
I decided to focus on extra-terrestrial causes, but you could take your tack on anything from economics to atmospheric physics. (Better leave the politics out of it). I also judged it was better to leave the Friends of Science name out of it also, as it seems to work on some people like a red flag on a bull. Here 's what I wrote, exactly 1000 words. Don 't just copy it!
I'm a geologist. I know that climate has always changed through geologic history. I know that temperature changes have always led CO2 changes on all time scales. I know that CO2 GHG do not cause more than a trivial amount of Warming. Our variable star (the Sun) affects our atmosphere, oceans and climate in various ways, through cyclic changes of its dual dynamo (electromagnetic), solar "wind" (varying flow of plasma and charged particles), and the interplanetary orbital conjunctions of the solar system that have gravity impact on the oceans and on the movements of the sun around the barycentre of the solar system.
All these are cyclic forces, which have been largely ignored by the IPCC, which has built its computer simulations on interactive linear parameters that are no more able to predict climate than a meteorologist can predict weather beyond five days. In my retirement I have built an appreciable library on these subjects.
AGW is a political scam. IPCC is a political organisation.
CliSci # 210 2015-08-09
Divorcing the Sunspot Data from the Global Temperature
The International Astronomical Union, according to
Science Daily reports on a paper that states that a properly corrected sunspot history suggests that climate change is not due to natural solar trends. They do this by "recalibrating" the Sunspot Number record. The so-called "Wolf numbers" are indeed subject to some interpretation in terms of what to count which as a genuine sunspot, how to count groups, etc., but this paper and its timing seems to have a political motivation. As for me, I prefer the paleoclimate use of the several isotopic series to somewhat subjectively counted sunspots in other than a gross manner.
Astronomer Prof. Kees deJager was quick off the mark. He reacted to the IAU paper this morning (pers.comm.) with the following:
"In a recent press release (August 7, 2015) the Int. Astronomical Union gives information on the recent revision of the international sunspot numbers. By comparing the thus obtained gradient of the annual sunspot numbers with that of the average terrestrial ground temperature it is concluded that significant positive deviations of the temperature gradient started already during the 18th century, thus strengthening the claims about anthropogenic effect on the earth 's temperature.
My comment is that the solar dynamo has two components, the equatorial and the polar one. Both contribute to the Earth 's climate, the first for 66% the other for 34% (De Jager et al. 2010). It is to be regretted that the authors that stand on the basis of the press release only considered the equatorial component, neglecting the polar one. That may give rise to doubting their conclusion.
In a recent paper (De Jager and Nieuwenhuijzen 2013) the two, bidecadally smoothed components are taken into account (agreed: with the previously accepted sunspot numbers). It is found there that significant non-solar deviations from the solar component start only early in the 20th century see Fig. 4 in that paper.
It would be interesting to repeat this research with the new data."
* C. de Jager, S. Duhau, B. van Geel, 2010. Quantifying and specifying the solar influence on terrestrial surface temperature. J. Atm. Sol. Terr. Phys.72, 926
* C. de Jager, H. Nieuwenhuijzen, 2013. Terrestrial ground temperature variations in relation to solar magnetic variability, including the present Schwabe cycle. Natural Science, 5, (10), 1112
These two papers (and many more) are available
HERE
The Younger Dryas Revisited
In PNAS, James Kennett et al discuss the Younger Dryas boundary level which is marked by a rich assemblage of high-temperature spherules, melt-glass and nano-diamonds, the production of which can be explained only by a major cosmic impact. Platinum is also consistently present in the layer. However, in order for the major impact theory to be possible, the YDB layer would have to be the same age globally, which is what this latest paper reports. At the end of the Glaciation the temperature rose sharply. Ice cores from Greenland recorded a rise of about 12 „ƒ to levels not far from today. After 2000 years of fluctuating climate, temperature plunged back to glacial level. where it stayed for 1300 years. That was the Younger Dryas. Finally warming occurred, first sharply, then more slowly to levels slightly higher than today. (Alley, R.B., 2003 Science 299 No.5615)
Using Bayesian statistical analyses of 354 dates taken from 30 sites on more than four continents, Kennett and his co-workers were able to calculate more robust age models, narrowing the age of the layer to 12,835 - 12,735 years before present. In addition, ice core samples, tree rings and varves were used.
Commenters on WUWT relate the evidence to Clovis culture, AMOC reversals, and other events, with some insisting that a cosmic origin is anywhere near proven. The Younger Dryas was a sudden cold event lasting some hundreds of years after the recovery from the previous glacial period had begun. An important key to that non-cosmic opinion is the shape of the YD anomaly, which ended more sharply than it began, i.e. the recovery from the temperature drop was far steeper than the descent. What is even more remarkable is the succession of steep temperature anomalies between 14,500 and 11,000 years ago of which the YD is part. They can be seen on
Don Easterbrook 's graph in a post on freerepublic '. (And read the comments!)
On first sight today 's reader might remark that anthropogenic CO2 was obviously not the culprit in the case of YD. But paleoclimate scientists have their own questions: Which of the associated factors being recognised are primary and which derived? What would be the nature of the Milankovitch mechanism that it could cause such repeated sudden swings? Can it be tied to gentle balance relationships of earth/planetary/solar forces that reach "tipping points"? (Banish the thought!).
If so, are our present 1000 year and centennial cycles related to them? The Grand Maxima and Minima of the Sun?
Stay tuned.
Hansen: Global Warming Causes Increase in Antarctic Sea Ice ..... Huh?
In a not-yet-published paper submitted to Atmospheric Chemistry and Physics, Hansen and 16 colleagues claim that global warming has caused the increase in the Antarctic sea ice which reached record levels in 2014. Their computer model, "exposes amplifying feedbacks in the Southern Ocean that slow Antarctic bottom water formation and increase ocean temperature near ice shelf grounding lines, while cooling the surface ocean and increasing sea ice cover and water column stability..."
(The article was not yet out at the time of writing, but it is said to deal mostly with the larger sea rise of the Eemian Interglacial. The Eemian was the previous interglacial, in the Late Pleistocene, between the Riss and W ¼rm Glacial Periods. It was much warmer than the one in which we live).
Effects of Volcanic Eruptions on Climate
Most smaller volcanic eruptions do not appear to leave much of an impression on climate beyond a few days, if at all, but
Eschenbach makes a case in WattsUp to show that the El Chicons, Pinatubos do have some effects that linger on beyond the immediate aerosols.
Concentrating his work on the last three decades, he concludes that the central paradigm of modern climate science is wrong temperature does not slavishly follow the forcings. To the contrary, when the tropical temperature changes, the solar forcing subsequently changes in the opposite direction, negating much of the effect of the volcanoes.
And in particular, the observations agree with the theoretical predictions, which were:
¢ Right after the eruption, there would be a reduction in available solar energy, due to the volcanic aerosols in the stratosphere.
¢ This initial eruption-induced reduction in available solar energy would be both deeper and sooner after the eruption in the hemisphere where the eruption occurred than in the opposite hemisphere.
¢ As a result, the corresponding climate reaction in the eruption hemisphere would also both be deeper and occur sooner than the climate reaction in the opposite hemisphere. In other words there will be a dose-related effect, where a larger reduction is met with a larger climate reaction.
¢ The form of the climate reaction will be an albedo reduction due to the temperature reduction, which will cause an increase in available solar energy. The increase in available energy will be of the same order of magnitude as the corresponding decrease due to volcanic aerosols.
CliSci # 209 2015-07-26
Baltic Herring, the Hansa League, the Reformation and Climate Change
Trust Dr Tim Ball to come up with
a very interesting article in WattsUp about what made the economy of Northern Europe blossom during the beginning of the Little Ice Age, through the mercantile Hanseatic League of trading ports that stretched from the Finnish Gulf to the English Channel, with the brackish Baltic as it core.
The Baltic Sea 's salinity is sensitive to fresh water inflow, subject to changes in climate; salinity is lowest in its northern extremity. The herring is an adaptable fish which was the underpinning of the food chain at the time, especially after - in the 14th century - Dutchman Willem Beukelszoon van Biervliet discovered a way in which to preserve gutted/beheaded herring in salt for trade. At the time it was an economic miracle and Van Biervliet is remembered in his homeland to this day.
The coming catastrophe of Climate Change
I am not one to indulge in opinion polls and surveys, but the persistent pressure which is being brought about by the IPCC on the world 's media and the flood of low-quality AGW-supportive "scientific" papers in the world 's Journals, are all unleashed to pave the road to the Paris UNFCCC/COP21 meeting at year 's end. Is it working?
More interesting than the straight Subject priorities are those divided by Human Development Index. Unfortunately, those with "very high HDI" are the people that will converge on Paris.
Corals and the rising sea level
The same truths have to repeated again and again. So Van Woesik, Golbuu and Roff have a new article in Royal Society Open Science called "
Keep up or drown: Adjustment of Western Pacific Coral Reefs to Sea-Level Rise in the 21st Century". Their conclusion is that "reef-coral growth will keep up with sea-level rise, but if greenhouse gas concentrations exceed 670 ppm atmospheric CO
2 levels and with +2.2 °C sea-surface temperature by 2100, [...] our predictions indicate that Porites microatolls will be unable to keep up with projected rates of sea-level rise in the twenty-first century." Pity they had to put that last one in.
While the model study of the Palau reef island group (Micronesia) is of some interest because of its methodology and while it confirms that the scare stories about massive drowning of Pacific island reefs are not warranted, this same methodology has a number of weaknesses that reduce its value.
These are tectonically active areas, located in the general area of the junction of the Thetis tectonic belt (Gibraltar to Indonesia) and the Circum-Pacific "Ring of Fire". Dr Manns, a Toronto geologist, says "reefs are killed off by turbidity, not tectonics or sea-level rise. Reefs are spread by hurricanes; not destroyed by them."
There has been no measured increase worldwide in the actual rate of sea level rise for the past hundred years (<2 mm/a), but the Pacific is a large body of water, subject to orbital and non-AGW ENSO forces; the Indian Ocean 's poster child Maldives are alive and are doing very well, supported by aid money for a disaster which is unlikely to happen.
(h/t F.M.)
Lifetime of CO2
The IPCC's assumption of life times of "new" CO2 of over a hundred years - which is based on the so-called Bern models - has been shown to be a ten-fold exaggeration by Swedish Em. Professor G ¶sta Pettersson. This is not a new paper, but it warrants repeating.
Dr. Pettersson finds that "the IPCC extremely (about tenfold) underestimated both the speed and way of final natural disposal of atmospheric carbon dioxide" by natural sinks. The assumption of the IPCC "Bern model" that 22% of the atmospheric carbon dioxide surplus can never be removed from the air seems quite amateurish considering that the present empirical observations confirms that at least 95% of the atomic bomb test excess of 14C-carbon dioxide had "already" been removed after 50 years."
She also states that "the IPCC has - for scientifically untenable reasons - turned a blind eye to the present very extensive and entirely consistent experimental results concerning CO2 relaxation and preferred to base their assessments on a mathematical model that lacks empirical support, and even contrary to the observations made."
A discussion of the above (in a cramped Google-translation from the Swedish) can be found on the HockeySchtick blog.
Feedback, positive or negative?
Also in the HockeySchtick is : "New paper finds greenhouse gases causing radiative cooling, not warming, at current Earth surface temperatures" which finds that radiation from greenhouse gases cause a direct warming effect that only begins to cause an additional positive-feedback warming effect at Earth temperatures 7 „ƒ warmer than the present (and significantly higher than IPCC projections for the next century), and that at the current Earth temperature of 288 K or 15 „ƒ, increasing greenhouse gas IR radiation cause a direct warming effect that causes a negative-feedback cooling effect upon surface temperatures. Thus, addition of greenhouse gases at the present surface temperature of 288 K (and up to 7 „ƒ warmer or 295 K) would have total warming effect that is less than the direct, or before feedbacks, of about 1 „ƒ for a doubling of CO2.
Convective organization may result from an instability of the background state of radiative-convective equilibrium, which results in separation of the atmosphere into moist regions with ascent and dry regions with subsidence. Numerical modeling studies suggest that this instability is temperature-dependent. If so, then the increasing tendency of convection to organize with warming could also alter the climate sensitivity significantly. It is unclear whether current global climate models capture this process adequately.
The increasing strength of the shortwave feedback with decreasing temperature is largely due to clouds. A negative longwave cloud feedback implies that the atmosphere itself is cooling more in the moist regions and cooling less in the dry regions, due to the presence of clouds. A key result is that the behavior of the radiative feedbacks varies with temperature, primarily due to the contribution of clouds. The paper "Self-aggregation of convection in long channel geometry" by Allison Wing and Timothy Cronin and abstract is here.
CliSci # 208 2015-07-12
Do CH4 and CO2 increases cause Global Warming?
An open access paper by
Chillingar et al in Atmospheric and Cimate Sciences 2014, 4,pp.819-827 asks whether increasing contents of CH4 and CO2 in the atmosphere cause Global Warming and conclude by examining the Greenhouse Effect using their adiabatic model, that petroleum production and other anthropogenic activities resulting in accumulation of additional "amounts of methane and carbon dioxide in the atmosphere have practically no effect on the Earth 's climate."
A discussion takes place in
The Hockey Schtick, where the anonymous comment on "July 5th at 3:18 am" is particularly fascinating.
Does UHI cause Global Warming?
Pierre Gosselin reports in the NoTricksZone that the Deutsche Wetter Dienst, the German "Met Office", has discovered that cities are particularly vulnerable to the effects of climate change,
so says its Vice President. The summer heat storage in pavement and concrete can increase city temperature by 10 „ƒ. The meteo VP seems to have discovered the Urban Heat Island by running a computer simulation. And the Editor starts with "Climate Change causes overheated cities". Really.
OK, it is unusually warm in Western Europe. The Dutch city of Maastricht, just across the border from Cologne last week measured a daily high of 37 „ƒ.
Albedo musings and Solar Activity
Radiative energy actually received by a planet is obviously affected by its albedo. Varying amounts are reflected.
Willis Eschenbach presents
a column in Watts Up With That? that challenges some commonly accepted seasonal variations and gets many comments that range from ice covers to the earth axis, and from hemispheric differences to decimal mistakes, only to be reminded by Lord Monckton and Duke Un. 's Robert Brown that it does not matter much because the influence of cloud cover outweighs all other factors of the earth ' albedo.
While that is amusing enough, one commenter (at 3:18 am), possibly fresh from attending last week 's Royal Astronomical Society meeting in Wales, shifts to the sources of the energy and focusses on predictions of activity of the "Solar Background Magnetic Field" which would be modulating the sunspot numbers.
This CBMF wave system would interact with the poloidal/toroidal dual dynamo.
(I wonder if this wave system is a consequence of the moving shell-like structure of the convection portion of the outer regions of the sun).
It is claimed that key parameters have been isolated that afford a prediction with a sufficient degree of confidence that the solar activity in cycles 24 26 will be systematically decreasing because of the increasing phase shift between two magnetic waves of the poloidal field, leading to their full separation into opposite hemispheres in cycles 25 and 26. This separation is then expected to result in the lack of their subsequent interaction in any of the hemispheres, possibly leading to decade or two, similar to those recorded in the Maunder Minimum cold period.
This seems to refer to work by Valerie Zharkova and colleagues who published a paper on the subject last year and gave a presentation at the RAS meeting. We may well have to wait for assessing what this all means, but I am happy to report that these things are being seriously investigated.
A possibly clearer and more authoritative review than mine appeared in
Tallbloke 's Talkshop .
A paper Prediction of solar activity from solar background magnetic field variations in cycles 21 23 by Shepherd and Zharkova was published last year. If your access is denied, you can get a pdf from me.
CliSci # 207 2015-06-30
Whims of El Ni ±o
For us here, on the West side of the American continent, much of our weather comes from the across the Pacific, albeit interrupted at times by dreaded Arctic vortices in the winter. This issue is dedicated to our oceans.
The Pacific Ocean is complex and the ENSO system actually reigns somewhat farther South than where we are. In fact the North Pacific circulation often dances to its own tune. Here are some recent papers on the problems, both in space and time.
You may have read about the predictions of an "El Ni ±o" earlier this year. It did not quite materialise, or did it? Will it yet? Did it elsewhere? Is one to cherry-pick places where it fits the prediction? Or is the definition of the area at fault?
"If we focus on the tropical Pacific, then the El Ni ±o processes in 2014 resulted in a relatively strong event definitely much stronger than what is reflected in the surface temperatures of the NINO3.4 region. The natural warming of the tropical Pacific in response to the two downwelling (warm) Kelvin waves last year helped to make 2014 the (possible) warmest year on record for the GISS, UKMO and old NOAA global land+ocean surface temperature datasets. But as discussed in the post
Did ENSO and the Monster Kelvin Wave Contribute to the Record High Global Sea Surface Temperatures in 2014?, The Blob in the eastern extratropical North Pacific was the primary cause of the uptick in surface temperatures last year.
2500 years of South China Sea Temperatures
CO2 Science reviews a paper by Yan, Soon and Wang that gives "A unique look into seasonality and seasonal climate changes during warm and cold periods". Earth-Science Reviews 141: 122-136" [$].
The Abstract, which is on Science Direct, describes the proxy work with corals and Tridagna clams for Sr/Ca time window resolutions and which are tied to modern day SST data. The results show (rather schematic in the review) two and a half 1000- year cycles. which include the Roman and Medieval Warm Periods and the (much lower) Current Warm Period with the Dark Ages Cold and LIA in between. The relative amplitude of these swings is interesting and, as CO2science adds, because these warmer-than-present periods occurred when the atmosphere's CO2 concentration was only about 70% of what it is today, it is likely that the atmosphere's CO2 content has had little to do with the development of the recent warmth of the modern era.
The Pacific West Boundary Currents
Boundary currents and ocean gyres are important elements in heat transport on Earth; they fundamentally control the Earth 's climate. The Kuroshio Current is a major boundary current in the western Pacific Ocean; it plays a key role in distributing heat from the tropics to the mid-latitudes and has been an important control on the climate of Northeast Asian for millions of years. This paper reviews evidence for the Pliocene to recent history of the Kuroshio Current and the Tsushima Current.
Thus begins a paper [Free Access] by
Gallagher et al in Earth and Planetary Science (2015) 2:17 . It then takes you to Fig 1 which shows the Kuroshio warm current which originates in the eddies of the Halmaheira and Mindanao Warm Pool, where it gets swept up by the North Equatorial Current along the West Pacific border lands, until it crosses the Pacific at about 35 degrees latitude.
The paper follows the history of this system by means of geomorphology, sedimentology, macro-paleontology and microfossil proxies over the past ten million years.
What is AMOC telling us?
The Atlantic "Gulf Stream" is part of the Atlantic Meridional Overturning Circulation which brings temperate climate to NW-Europe, as far North as Iceland. It gives up its heat to the atmosphere, sinks and returns as a bottom current towards the South. It is known that the latitude at which this historically happens is related to paleoclimate of the time. There have been periods, e.g. during the rather wild swings of the Dryas/Aller ¸d in the early Holocene (about 12,000 years ago) that the Gulf Stream "crossed over" from the American East coast to Europe at the latitude of Portugal, leaving any early Brits to the North rather chilly.
Short, sharp, substantial warming periods ("interstadials") have been recognized during glacial periods and sudden, short severe cold periods have been found during interglacial periods like our own, the so-called Heinrich events. Some have been worldwide, others limited to the North Atlantic, all with signs of AMOC's involvement. The Younger Dryas event may have been a Heinrich event. Another cooling event occurred 8200 years ago.
Much has been published over the years, but cause and mechanism are still up for debate. A number of factors are involved and it sounds like a chicken-and-egg problem. Remarkably, there is not much talk about solar system influences.
The most prominent hypothesis is that the cooling was caused by a slow down of the (AMOC) following melt water input to the North Atlantic. Although this melt water hypothesis is widely accepted, it has been marred by the lack of physical evidence for a sudden major flooding event and it is silent about cause. Alternative hypotheses for the Younger Dryas onset include dimming and cooling induced by volcanism, wildfires or extra-terrestrial impact.
In
Science 348; 6241 Srokov and Bryden report that "Observing the [AMOC] yields a decade of inevitable surprises". The last ten years have seen a continuous in-depth study of AMOC variability, which appears to be much larger than earlier assumed. A 30% decline in volume was measured in 2009-2010 and exceeded any ranges used in IPCC models; in fact, over the period of the observations, the AMOC has been declining at a rate of about 0.5 Sv per year, 10 times as fast as predicted by climate models. (A "Sv" - sverdrup - is a million cubic metres per second).
UK Met Office sees the sun cooling
This may seem like nothing new for regular readers, but for the Met Office to shake itself to life and to see reality it is an astounding switch. I can do no better than to refer you to a selection of items in the
June 15th GWPF issue.
CliSci # 206 2015-06-20
Stalagmites are Popular
The record correlates with historic human civilisation phases and population movements.
The Pope and Climate Science
And while you 're at it, read Lawrence Solomon 's accompanying FP piece "
Nature needs a hand", setting eco/egocentric concerns beautifully in geological Time and Space.
Being aware of religious sensitivities, your editor will refrain from comment, beyond noticing that we have here a religious belief-based Authority speaking out on the religion of climate science; He likes what he sees.
The Pacific Ocean's Western Boundary Currents - a comment.
An international, but mostly Chinese platoon of 17 investigators, led by Dunxin Hu, has published a study in Nature 14504 entitled "
Pacific Western Boundary Currents and their roles in climate" [$] which attempts to disentangle the complex circulation system of the "WBCs" and their influence on the ENSO and the Pacific Decadal Oscillation. Anyone seriously interested in the paper can get a copy from me.
As we know, due to the size of this enormous body of water, the movements of the Pacific have an influence on climate that is noticed across the globe, through the Atlantic and the Indian monsoon.
The currents themselves are influenced by the earth ' rotation and winds, says Henri Masson in a private communication, and the most sophisticated GCMs do not take them quantitatively into account.
He advocates that we begin to finally recognize the importance of a systemic analysis, no longer of the insulator, the supposed anthropogenic contribution to global climate change, but by coupling to purely natural phenomena (which should ultimately match "forcings" much larger than those of greenhouse gases. What is happening in the oceans (the Pacific and in particular; it is the largest) is fundamental to the natural regulation of the climate.
With the system being quasi chaotic, there are discoverable periodicities in time series, periods which are comparable to those of planetary conjunctions and of cycles of the sun.
With data of this nature, we must stop making linear analyses as if we were dealing with a linear system instead of a chaotic, dynamical system which has an extremely limited predictability horizon, given its highly non-linear nature and therefore its sensitivity to initial conditions and model parameters.
(Dr Masson, an engineer by training, is a Professor in the Economics Faculty of the U. of Antwerp, Belgium)
Variability in the Sun-Earth System
CAWSES (Climate And Weather of the Sun-Earth System)-II is an international program conducted from 2009-2013. This is a heavy fact-laden 41 page paper and the main point in mentioning it here is to make you aware of the enormous amount of analytical work that is being done on the sun and its emanations.
From the Abstract:
[......] The short-term variability that has immediate consequence to Earth and geospace manifests as solar eruptions from closed-field regions and high-speed streams from coronal holes. Both electromagnetic (flares) and mass emissions (coronal mass ejections - CMEs) are involved in solar eruptions, while coronal holes result in high-speed streams that collide with slow wind forming the so-called co-rotating interaction regions (CIRs). Fast CMEs affect Earth via leading shocks accelerating energetic particles and creating large geomagnetic storms. CIRs and their trailing high-speed streams (HSSs), on the other hand, are responsible for recurrent small geomagnetic storms and extended days of auroral zone activity, respectively. The latter leads to the acceleration of relativistic magnetospheric killer ' electrons. One of the major consequences of the weak solar activity is the altered physical state of the heliosphere that has serious implications for the shock-driving and storm-causing properties of CMEs. [.....]
CliSci # 205 2015-06-10
Nir Shaviv in Calgary
On June 2nd a sold-out house heard Dr Nir Shaviv explain that our variable star is the main contributor to changes in the earth 's climate. The video of his presentation should be accessible on the FoS website by the time this newsletter reaches you. Otherwise, you could have a fair idea of his thoughts from the video of his
2012 EIKE lecture in Munich .
A press release was issued by FoS relating his conclusions to the claims by the CEO of a major oil company who advocated that a broad-based carbon tax could be necessary to affect climate change..
Mobilising for Paris
It seems that the IPCC realises that the 21st "Conference of Partners" is a Do-Or-Die proposition for them. Since the beginning of the year there has been a sustained effort on many fronts to publish as many papers, hold as many meetings and give as many speeches as they can manage. The papers may be kicking in open doors as to their level of relevance, or are reworked repeats of older ones, but they are designed and pushed to create headlines in the compliant MSM outlets.
The science is not escaping these efforts. As if Essex and McKitrick did not expose the manipulation of the processing of international temperature data as early as 2002, here comes Thomas Karl et al's
pompously released paper in Science from NOAA 's National Climate Data Center which is trying to cut that annoying "pause" out of the record. It seems that a Propaganda Ministerium has seen to it that it reached most major papers. (Sorry - I survived through Nazi occupation).
The authors combine terrestrial measurements with those made at sea (in fact mostly sea surface temperature) which are capable of being mathematically equal to those of the air if we admit convective heat exchange between ocean and atmosphere; they adjust and correct with the experimental data collected at sea - from different sources - each requiring their own adjustments (ships, satellites, buoys). The authors realize that by making a linear regression on (multi-) periodic signals (and some periods comparable to the length of the measurement window), the slope of the regression line depends on the starting point and the length of the measurement window. A statistical trick that has been used before.
One can get an idea of the present sea surface temperature manipulation of the ERSST graph
HERE , where it bounces between version 3 and the new-and-improved version 4. The pre-1970 temperatures are now magically reduced and the later ones increased. Lo and behold, the Pause is gone, which must surprise a collection of IPCC's supporting scientists, whose earlier admissions of the Pause were recorded
HERE in the WUWT comment section.
Ross McKitrlck comments on WUWT on the Karl paper. Most of the usual sceptic blogs have much to say about the paper, none of it supportive.
As stated above, these are land and sea temperature data.
Peiser 's GWPF says "This is a highly speculative and slight paper that produces a statistically marginal result by cherry-picking time intervals, resulting in a global temperature graph that is at odds with those produced by the UK Met Office and NASA. Caution and suitable caveats should be used in using this paper as evidence that the global annual average surface temperature hiatus of the past 18 years has been explained".
His UAH and RSS satellite plots show resp. 219 and 220 months of a No Warming Linear Trend.
(h/t to Henri M.)
The story of four temperature datasets
Independent of the above,
an interesting analysis is found on WUWT of the development of two different sets of temperature data, one being the surface temperature series of GISS and HadCRUT, the other the satellite ones of UAH and RSS.
They all have "new, upgraded versions", as if we were talking about the latest cell-phone, but the interesting part is how the two measuring systems are increasingly diverging from each other.
Essentially the satellite Lower Troposphere series have now been flat for 18 years and 4 or 5 months. The Surface Temperature series "the slope has not been flat for any period worth mentioning".
There are detailed graphs on all of this on the June 9th WUWT issue, compiled by Werner Brozek.
"T Rex" is alive and well and living at the IPCC.
EC and the Climate Change project
The above article by Karl, who is the Director of NOAA 's national data centre, the NCDC, shows how data are being manipulated to fit the political result required. I have called this sort of effort "Bespoke Climate Science", a term now also
used by Carles Battig M.D.
In a
guest essay in WattsUp? Tim Ball traces the history of the national Weather Offices in their support of the IPCC 's hypothesis. As Richard Lindzen points out, the number of countries is more important than the qualifications of their weather office staffs.
From the days of the IPCC organisational meetings, now 30 years ago, till today, Environment Canada has been its slavish lackey, but so have many similar national bodies, under the leadership of the World Meteorological Organisation, an agency of the United Nations.
It was all just as Maurice Strong intended.
Climatologist Ball, a "climatologist Ph.D." avant la lettre, at least in Canada,
knows where all the bodies are buried.....
The News from Garmisch-Partenkirchen (June 8th)
The G7 considered a proposal for early achievement of a "global low carbon economy" by 2050 but dropped it due to pressure by Canada and Japan.
The new consideration is now for a "de-carbonisation" to be achieved by the end of this century.
The G7 final Document is
HERE ; "Climate" starts on page 12.
See
WUWT and
GWPF "decarbonisation by 2099" ......
Peter Foster in the Financial Post 10/6, p. FP 13 concludes: "G7 kicks the Climate Can off the Planet.".
CliSci # 204 2015-05-30
NE India stalagmites, monsoons and two PDOs
A fifty year record of stalagmites in an Indian cave shows correlations with Pacific oscillations and the Indian Monsoon. Lead authors are Myers and Oster who wrote an article in GRL: "Northeast Indian stalagmite records Pacific decadal climate change: Implications for moisture transport and drought in India". Geophysical Research Letters, 2015; [$] DOI:
10.1002/2015GL063826(Abstract).
A more substantial review comes out of VanDerBilt university and appeared in
Science Daily
The dangers of a colder climate
Meteorologist Joseph d 'Aleo and our long time supporter, engineer Allan MacRae have
posted an essay in WUWT "Winters, not Summers Increase Mortality and Stress the Economy". The article draws on published studies from around the world,ranging from
The Lancet (which finds that - worldwide - cold weather kills twenty times as many people as hot weather) to
Associated Press which reports various sources noticing that economic activity during a year 's first quarter is substantially less than during the summer and fall.
Yes Allan, but I have often wondered, why the 17th century, which was the centre of the Maunder minimum, was Holland 's "Golden Age" during which miserable weather did not prevent that country to be become wealthy, as Commerce and the Arts prospered and blossomed.
(Simon Schama -" The Embarrassment of Riches", 1988)
It was also the end of a debilitating European war and the blossoming of the Reformation.
The article appears also
HERE on the FoS website.
A multi-decadal Change
Gerard McCarthy et al (University of Southampton) have a paper in Nature 2015;21, [$]; "Global climate on verge of multi-decadal change", reviewed
HERE, that seems to have discovered the sixty year cycle.
"The global climate is on the verge of broad-scale change that could last for a number of decades a new study implies. The change to the new set of climatic conditions is associated with a cooling of the Atlantic, and is likely to bring drier summers in Britain and Ireland, accelerated sea-level rise along the northeast coast of the United States, and drought in the developing countries of the Sahel region."
The study "proves that ocean circulation is the link between weather and decadal scale climatic change. It is based on observational evidence of the link between ocean circulation and the decadal variability of sea surface temperatures in the Atlantic Ocean."
Lead author Dr Gerard McCarthy, from the NOC, said: "Sea-surface temperatures in the Atlantic vary between warm and cold over time-scales of many decades. These variations have been shown to influence temperature, rainfall, drought and even the frequency of hurricanes in many regions of the world. This decadal variability, called the Atlantic Multi-decadal Oscillation (AMO), is a notable feature of the Atlantic Ocean and the climate of the regions it influences."
I wonder why this is now being published by a high level journal like Nature. This all has been known for many years. It 's nice to remind us of the interrelationship of various atmospheric and oceanographic variations, but shouldn 't one expect some questions being raised about why these cycles are occurring?
Also as item 5 in
GWPF, with the well-known AMO chart, W
UWT,
JoNova and others.
The radiation role of nitric oxide; A new index
The NASA Thermosphere-Ionosphere-Mesosphere Energetics and Dynamics satellite has been measuring thermospheric cooling by Nitric Oxide for over 13 years.
The authors show that the time series of globally integrated infrared power (watts) radiated by NO can be replicated accurately by a multiple linear regression fit using solar magnetic indices. This allows reconstruction of the NO power time series back nearly 70 years with existing databases of these indices.
The NO power is a fundamental integral constraint on the thermospheric climate, and the time series presented can be used to test upper atmosphere models over seven different solar cycles.
The multiple regression fit has also enabled the relative roles of solar irradiance and geomagnetic processes in driving the NO cooling to be determined. In general, solar UV irradiance is the primary factor that determines the NO cooling, particularly at solar maximum. During solar minimum conditions, geomagnetic processes may rival the solar irradiance in driving the radiative cooling by NO.
Their proposed index provides a key measure of the state of the thermosphere that is not captured by other individual metrics. This is an important point as individual metrics such as sunspot number do not adequately reflect all of the processes which cause the atmosphere to respond to solar variability.
CliSci # 203 2015-05-20
The Missing Hot Spot
Auditing the Global Carbon Budget
A paper by Ballantyne et al in Biogeosciences 12 discusses "Audit of the global carbon budget: estimate errors and their impact on uptake uncertainty". Published by Copernicus, it is
freely downloadable,
Abstract: "Over the last 5 decades monitoring systems have been developed to detect changes in the accumulation of carbon (C) in the atmosphere and ocean; however, our ability to detect changes in the behaviour of the global C cycle is still hindered by measurement and estimate errors. Here we present a rigorous and flexible framework for assessing the temporal and spatial components of estimate errors and their impact on uncertainty in net C uptake by the biosphere. We present a novel approach for incorporating temporally correlated random error into the error structure of emission estimates.
[and:]
Given all the major sources of error in the global C budget that we could identify, we are 93 % confident that terrestrial C uptake has increased and 97% confident that ocean C uptake has increased over the last 5 decades. Thus, it is clear that arguably one of the most vital ecosystem ser-vices currently provided by the biosphere is the continued removal of approximately half of atmospheric CO2 emissions from the atmosphere, although there are certain environmental costs associated with this service, such as the acidification of ocean waters."
Wished they would have left that obligatory last nonsense out of it....
Arctic may become a temperate zone
No Comment
Hoist by its own petard
In league with many oil companies, Shell has had a tattered scientific approach to the CAGW hypothesis and the IPCC. Employer of many earth scientists and engineers, they would be in a position to know the true situation about the carbon craze and about climate science.
A dozen years ago your editor visited with a Shell V.-P. to solicit some moral support for our fledgling organisation , only to be told that, while he personally was completely in line with our thinking, Shell was interested in selling oil products and that its customers would not appreciate Shell supporting critics of what many would consider the IPCC's environmental crusade. Instead, Shell has openly accepted the Global Warming hypothesis.
Solar and ENSO components in satellite data
Daniel Howard, Nir Shaviv and Henrik Svensmark have an
article in JGR that examines the irregularities of satellite altimetry data. They show that previously unexplained variances in measured data are due for at least 70% to a combination of solar forcing and El Ni ±o/ENSO oscillations and say that "The phase of the solar component can be used to derive the different steric and eustatic contributions. [They] find that the peak to peak radiative forcing associated with the solar cycle is 1.33 ± 0.34 W/m2, contributing a 4.4 ± 0.8 mm variation [........] The ENSO contributes a peak to peak variation of 5.5 ± 0.8 mm, predominantly through a direct effect on the MSL and significantly less so indirectly through variations in the radiative forcing."
The article is freely downloadable in pre-print version from the above link.
Reminder: Dr Nir Shaviv's lecture June 2nd
Israeli Astrophysicist Dr Nir Shaviv will be our honoured guest for an evening presentation on "Solar forcing and our understanding of past and future Climate Change".
Dr. Shaviv will explain and demonstrate that the sun is an important climate driver, but it is missing from the standard climate analyses. As a consequence, the standard (i.e. IPCC) models have a much higher climate sensitivity than the real Earth has, such that future climate response to anthropogenic forcing (human industrial activities or emissions that may affect climate), will be "much more benign than alarmists frighten us with." Dr. Shaviv's presentation will be of interest to the general public as well as those in the sciences.
For background details of venue, parking and tickets see HERE.
CliSci # 202 2015-05-10
Dr Nir Shaviv lecture June 2nd
Israeli Astrophysicist Dr. Nir Shaviv will be our honoured guest for an evening presentation on "Solar forcing and our understanding of past and future Climate Change".
Dr. Shaviv will explain and demonstrate that the sun is an important climate driver, but it is missing from the standard climate analyses. As a consequence, the standard (i.e. IPCC) models have a much higher climate sensitivity than the real Earth has, such that future climate response to anthropogenic forcing (human industrial activities or emissions that may affect climate), will be "much more benign than alarmists frighten us with." Dr. Shaviv's presentation will be of interest to the general public as well as those in the sciences.
For background details of venue, parking and tickets see
HERE The inner Sun and the coming Minimum
A guest essay by David Archibald in WUWT speculates on the nature of future Solar Cycle 25 on the basis of magnetic field measurements, but it gets really interesting in the comment section, when Leif Svalgaard and William Astley start sparring at 7:52 a.m. (May 8th) for the next three hours. The subject drifts to what is really happening at the sun 's tachocline, with Astley invoking a sun 's planet-induced barycentre movement (SIM) and Svalgaard wanting to have none of it.
Tipping Points
In
The Daily Caller Michael Bastasch revisits the 25 years year history of Global Warming alarmists' hysterical Tipping Point predictions.
In fact, in the late 1980s the U.N. was already claiming the world had only a decade to solve global warming or face the consequences.
Let us remember two quotes from H. L. Mencken:
"The urge to save humanity is almost always a false front for the urge to rule it". and
"The whole aim of practical politics is to keep the populace alarmed (and hence clamourous to be led to safety) by menacing it with an endless series of hobgoblins, all of them imaginary."
Possible climate impacts from a Grand Solar Minimum
From the above linked Abstract:
"Over the second half of the 21st century, the scenario assumes a decrease in total solar irradiance of 0.12% compared to a reference RCP8.5 experiment. The decrease in solar irradiance cools the stratopause (~1 hPa) in the annual and global mean by 1.4 K. The impact on global mean near-surface temperature is small (~ ˆ’0.1 K), but larger changes in regional climate occur during the stratospheric dynamically active seasons. In Northern hemisphere (NH) winter-time, there is a weakening of the stratospheric westerly jet by up to ~3-4 m s1, with the largest changes occurring in January-February. This is accompanied by a deepening of the Aleutian low at the surface and an increase in blocking over northernEurope and the north Pacific. There is also an equator-ward shift in the Southern hemisphere (SH) midlatitude eddy-driven jet in austral spring. The occurrence of an amplified regional response during winter and spring suggests a contribution from a top-down pathway for solar-climate coupling; this is tested using an experiment in which ultraviolet (200 320 nm) radiation is decreased in isolation of other changes. The results show that a large decline in solar activity over the 21st century could have important impacts on the stratosphere and regional surface climate.
As I said, this is a model.
Temperature chart update
The Global Lower Troposphere graph on the FoS website now uses the UAH version 6.0. and RSS version 3-3.
These satellite data have been updated to April 2015 (UAH) and reduce the trend line from January 2002 to April 2015 to a small declining trend of -0.04 Celsius/decade.
The graph is
here, in the Introduction to the FoS 'Science Essay '.
Nature 's advice to climate advisors
In
Nature 521 #7550 Oliver Geden warns that "as global negotiations fail on emissions reductions, scientific advisers need to resist pressure to fit the facts to the failure" and that "Disenchantment has set in well ahead of the 21st Conference of the Parties (COP21)". Apparently that should mean "disenchantment not to be able to stick with the alarmist AGW projections of past years, regardless of the changes in their WG I science reports".
This is an interesting look at the mentality of the negotiators, to who scientific results are subject to what is politically possible. Not that one should have been surprised at this upside down world.
Mr Geden does not like giving in to facts or to more conservative interpretations: "For example, the fourth assessment of the Intergovernmental Panel on Climate Change (IPCC), published in 2007, stated that emissions must peak by 2015 to stay within 2 °C of warming; yet the fifth IPCC report, released last year, refers to 2030 emissions levels higher than today's that are still compatible with this limit, albeit with annual emissions-reduction rates of 6%. The annual Emissions Gap Report by the United Nations Environment Programme (UNEP) had an original deadline of 2020 for its analysis of how to fill the gap between global emissions levels compatible with a 2 °C target and national pledges; the 2014 edition extended it to 2030."
So, to them the warming targets of AR5 which refer to a 2 degree maximum by 2030 have been eased from those at 2020 (AR4) in order to make it easier to reach an agreement, not because the WG I scientific projections were found to have been unrealistically high.
CliSci # 201 2015-04-30
Solar Cycle Length and Magnetic Activity
It is 24 years ago that Friis-Christensen and Lassen (Science V.254 No 5032) advocated the use of solar cycle length as an indicator of solar activity (rather than Wolf numbers.) It is now becoming clear that the cycle length is closely associated with the solar spectral irradiance (SSI).
Choi et al have a paper in The Astronomical Journal that makes comparisons with similar stars and note the substantial difference in correlation with climate between TSI and SSI. They find the latter more relevant.
Adding Solar Spectrum Irradiance to the Equation
Further to the above, the impact of variability of Solar Spectral Irradiance (SSI) on climate is attracting increasing attention. It is a quantity not included in TSI and Ilaria Ermolli and a group of twelve researchers have published a 30 page study in "Atmospheric Chemistry and Physics" (Copernicus, free download) to present an overview of present knowledge.
"Special attention is given to the role of the UV spectral region, whose small contribution to TSI is compensated by a high relative variability with a potentially amplified influence on climate through radiative heating and ozone photochemistry. There is, today, clear evidence for the impact of solar variability on climate but both its magnitude and its confidence level are still subject to considerable debate."
"TSI alone does not adequately describe the solar forcing on the atmosphere and therefore SSI variations have to be taken into account in climate models."
Those interested should at least read the Abstract, as well as the Conclusions on p.3968.
Global Temperature - GWPF Launches an Inquiry
The IPCC 's case rests on the CO2 dogma (in doubt since Arrhenius second thought about water vapour in 1906 and disproven as a main 'forcing agent' since), the computer simulations (proven to be so far from reality over a 30 year run as to be useless for projection purposes) and the data record of Global surface Temperatures (already debunked by Essex and McKitrick in "Taken by Storm" 2002).
The temperature record has often been criticised by its method of recording, gathering, by projecting grid cells over empty oceans and deserts and by "adjustments" for any number of subjective and proxy considerations.
The GWPF has launched a major inquiry into the integrity of the official record, headed by Professor Terence Kealey (University of Buckingham) who says: Many people have found the extent of adjustments to the data surprising. While we believe that the 20th century warming is real, we are concerned by claims that the actual trend is different from or less certain than has been suggested. We hope to perform a valuable public service by getting everything out into the open.
He is asking for input from everyone concerned with the issue.
>400 Comments on WUWT.
John A. Eddy, who died in 2009 at age 78, became active as a solar physicist in the middle of the period when solar activity and climate began to regarded as being connected. He had then to battle the same negativism and rejection as we do today. He identified the decreases in sunspots, described by Sp ¶rer and Maunder for what they were.
It has been proposed that the coming solar minimum be named after him.
He was interviewed by an old friend and colleague, ten years before his death. It is a fascinating first person account of digging through old records, writings and historical, even antique ' sunspot and climate observations, leading to a realisation of the nature of the solar minimum, its connection to the LIA and the nonsense of a 'solar constant '.
Remember that Sallie Baliunas reported on the LIA misery being blamed on witches at the time; early last century it was believed to be associated with the Thirty Year War (1618-1648). It is interesting to see how little was known beyond basic "dull" astronomy in the days when Eddy started his career, which must have been as late as the fifties.
Five years in Solar Orbit
Spend five minutes with NASA 's Solar Dynamics Observatory which has been orbiting the sun for five years now.
There are several other videos on this site, some associated with NASA, some not. Interestingly, most have a realistic attitude towards the solar connection with the coming global cooling.
CliSci # 200 2015-04-20
Amateur hour at The Economist
The Economist is a politics/economics weekly which I admire for its grasp of issues worldwide. It has a science section in which it reports on new discoveries and technical and medical issues.Once in a while it goes whole hog into a specific science area. When it deals with the earth sciences (and climate) which I happen to know a thing or two about, there appears to be no obvious expert supervision of the complex topic and hobby horses appear as the single-minded consultants with single-minded explanations and some old-fashioned alarmist writing.
So it does in the "Briefing" section of its April 11th issue when it tackles a subject called "Volcanoes and Climate". Let us first observe that they do not really talk about climate in its general ~ thirty-year definition, as none of their volcanic outpourings had such a long term influence. One would have to go back in geologic time to the Deccan Traps (Late Cretaceous) and the Karoo basalts (Lower Jurassic) to find anything that would qualify.
Its main example is Tambora (Sumbawa Island, Indonesia) which blew its top in 1815 and sent masses of rock, dust, sulphuric gases and ash into circulation around the globe. It darkened skies and - so claims the Economist - the year thereafter washing lines froze in the New England summer, "glaciers surged down Alpine valleys at an alarming rate", thousands starved in Yunnan, typhus spread through Europe, grain was in short supply in Europe.
Now it was, they say, the sulphur dioxide, which "over the following months oxidized to form sulphate ions which developed into tiny particles that reflected away some of the light coming from the sun", so the earth began to cool down. I'm sure Svensmark would blush because he had not thought about this ....
Let's put this Tambora explosion in the time frame: We are talking about the Dalton stage of the Little Ice Age, but not a word about that "coincidence" in the article. Sallie Baliunas' witches had nothing to do with it either.
Dr Robock at Rutgers University has models that explain it all and in the last of the four Economist pages he explains in detail what our "climate" would be in case such an explosion would occur at the present time. Climate seems to have a one issue cause. One thing good about this article: No mention of CO2, but not of cosmic rays or solar radiation either. Still wondering about these 'surging glaciers' though.
Early warning of earthquakes
While The Economist does take science seriously (as long as it does not interfere with its lame attitude towards causes of climate change), it sometimes ventures into the mysterious. An article in the current edition about
USGS work on better recording of preceding tremors is all on the level, but another one, entitled The
Chickens are Restless appeared on March 28 and discusses the work of Friedemann Freund, who had set camera traps to record animal behaviour (numbers mostly) in California 's earthquake trend. Five days before a quake, numbers of trap-spotted animals had dropped to a total of three, while the previous average had been eighteen. The fauna had "stopped moving around".
"Dr Freund believes that what animals sense before earthquakes is airborne electric charge. The idea is that the subterranean grinding of stressed rock - which precedes a quake - stores charge (not unlike that built up by scuffing shoes across a carpet), some of which then flows to the surface, where it ionises molecules in the air. The varying electric field involved in this phenomenon should be detectable from afar.
The team therefore studied data from two very-low-frequency (VLF) receiving stations in Peru, looking for perturbations of the signals. Sure enough, large disturbances occurred in the two weeks prior to the quake.Various climate researchers have mentioned a connection between electricity and earthquakes; they often hold that the electric heliosphere causes tectonic changes in the earth crust; others have expressed the opinion that the major subduction zones (like California and Peru) are influenced by active areas of the electric field of the earth interior itself.
Chicken and eggs all over.
T->CO2 in ice cores, but also in today 's atmosphere?
Ole Humlum and Norwegian colleagues have been using data series on atmospheric carbon dioxide and global temperatures we investigate the phase relation (leads/lags) between these for the period January 1980 to December 2011. Ice cores show atmospheric CO2 variations to lag behind atmospheric temperature changes on a century to millennium scale, but modern temperature is expected to lag changes in atmospheric CO2, as the atmospheric temperature increase since about 1975 generally is assumed to be caused by the modern increase in CO2.
The paper is in Global and Planetary Change 100, p.51-69 ($).
The Abstract continues:
"In our analysis we use eight well-known datasets:
1) globally averaged well-mixed marine boundary layer CO2 data,
2) HadCRUT3 surface air temperature data,
3) GISS surface air temperature data,
4) NCDC surface air temperature data,
5) HadSST2 sea surface data,
6) UAH lower troposphere temperature data series,
7) CDIAC data on release of anthropogene CO2, and
8) GWP data on volcanic eruptions.
Annual cycles are present in all datasets except 7) and 8), and to remove the influence of these we analyze 12-month averaged data. We find a high degree of co-variation between all data series except 7) and 8), but with changes in CO2 always lagging changes in temperature. The maximum positive correlation between CO2 and temperature is found for CO2 lagging 11 12 months in relation to global sea surface temperature, 9.5 10 months to global surface air temperature, and about 9 months to global lower troposphere temperature. The correlation between changes in ocean temperatures and atmospheric CO2 is high, but do not explain all observed changes."
About the difference between the modern time lag (< 1 year) versus the ice core lag (~800 years), the authors agree with
Severinghaus (Nature 391, 1998) that this is presumably reflecting the much coarser time resolution provided by ice cores, displaying only changes on a multi-decadal scale. This is partly due to sampling resolution, partly due to gas diffusion within the ice that averages out any surface temperature variability shorter than a few decades.
(h/t Ed Klovan)
PIK is having second thoughts
Among the CAGW fortresses around the world the Potsdam Institute for (K)limate in Germany is the strongest and most outspoken in Europe. So it is news when they announce in a Press Release that natural variability has been underestimated and that we are currently facing a cooling period.
'Progress in Earth and Planetary Science'
This is the name of a Springer open journal that presents a series on the current research work on the Sun-Earth connection. The second phase of the Task Group of SCOTEP has been asking the following questions, most of which are "beyond TSI":
1. What is the importance of spectral variations to solar influences on climate?
2. What is the effect of energetic particle forcing on the whole atmosphere and what are the implications for climate?
3. How well do models reproduce and predict solar irradiance and energetic particle influences on the atmosphere and climate?
CliSci # 199 2015-04-10
Notice
The May 5th Annual Frontier Centre for Public Policy Luncheon meeting with Donna Laframboise has been cancelled due to the surprise provincial election call for the same date. See the FoS web page for further information.
IPCC 's future according to Nature
Never mind that the science foundation of WG I of the IPCC 's work is slowly disappearing into the quicksand,
David Victor, writing in Nature wants to enlarge the Panel's superstructure of mitigation and abatement programs (WG III) to "Embed the Social Sciences in Climate Policy".
A lucrative source of employment awaits the graduates of social university programs presently serving as baristas.
Abdussamatov: A grand Minimum in your future
Habibullo Abdussamatov is a well-known astronomer at the Saint Petersburg Pulkovo Observatory and an advocate of a main solar cause of global climate changes for tens of years. In
a new paper (yet to be published, I believe) he gives his reasons why the decrease in solar energy since about 1990 - an expression of the quasi 200-year cycle - will lead to a Grand Minimum, which he says is the 19th Little Ice Age in the past 7,500 years. Maybe we should stop referring to the "pause" and call it the "plateau".....
The Grand Minimum deep phase will start around Solar Cycle 27 - that is around 2040 - and will last into the beginning of the next century.
The behaviouor of the approximate 200 year TSI cycle was also pinned down by
Timo Niroma just before his death in 2009 and is a solid option for astronomers
Kees de Jager and Silvia Duhau who noted its relationship to two Gleissbergs ' and to the solar dynamo 's phase transitions.
Our civilisation blossomed during the solar Grand Maximum which - says Abdussamatov - had its natural end around 1990 (note the effect of oceanic delay).
Shouldn 't our governments be preparing for the hazards of a prolonged Global Cooling?
Springtime in Europe
Pierre Gosselin provides
a series of graphs on his blog that indicate that continental European February and March temperatures and plant growth show a gradually decreasing average (~1 ½ „ƒ), resp. a later occurrence of "spring" (10 days) over the last 28 years.
Revisiting the APS statement
The policy statement by the Executive of the American Physical Society of some years ago was sufficiently controversial that a number of sceptical members severed their ties with the APS.
The Society is now engaged in a regular revision of the statement and has
circulated a draft to members for comment. Apart from the normal differences between protagonists and antagonists, it is pointed out by critics that such a large portion of its member-physicists have no actual knowledge of the complicated climate science field.
It has been reported that the APS statement was e-mailed in such an inoccuous way that it landed in Junk Mail folders and was deleted by some recipients without reading. Suspicions arise.
Judith Curry comments on the project on her website and is as critical as ever. Addressing the APS, she closes with: "no one cares about your political preferences in the climate change debate. You have demonstrated that you bring nothing intellectually to the table (once Koonin and Rosner left). You simply have no business issuing a policy statement on climate change. You have embarrassed the APS membership."
Details of the solar cycle
Science Daily reports on work done on finding the mechanism and an explanation for the pattern for the solar sunspots, flares and mass ejections. Researchers are mapping an interaction of overlapping activity bands within the 22 year magnetic polarity Hale cycle. The quasi-periodic bands appear to be driven by the rotation of the Sun 's deep interior and appear to have an influence on the number of flares and coronal mass ejections. The well-illustrated
Nature paper by Scott McIntosh and a mostly Colorado-based team entitled "
The solar magnetic activity band interaction and instabilities that shape quasi-periodic variability" describes how the twisted toroidal bands of the 22-year magnetic polarity cycle are embedded in the Sun 's convective interior and first appear at high latitudes (~ 55 degrees) before travelling equator-ward.
These bands interact with the oppositely polarized magnetic band from the previous cycle at lower latitudes in each hemisphere. This process modulates the occurrence of sunspots on the low-latitude bands (which have opposite magnetic polarity and sense of handedness) until they eventually cancel across the equator.
This equatorial cancellation signals the end of the sunspot cycle and leaves only the higher-latitude band in each hemisphere. Sunspots rapidly appear and grow on that band for several years until a new oppositely signed band appears at high latitude (for example, 2001 in the north, and 2003 in the south) an occurrence that defines the maximum activity level of that new cycle and triggers a downturn in sunspot production. The perpetual interaction of these temporally offset 22-year activity bands drives the (quasi-) 11-year cycle of sunspots that form the decadal envelope of solar activity.
Curry: An Availability Cascade destroys ability to think rationally
On her blog
Climate Etc. Judith Curry bemoans the 'Climate Change Availability Cascade', based on a study in
Stanford Law Review by Kuran and Sunstein, who define an Availability Cascade as "...
a self-reinforcing process of collective belief formation by which an expressed perception triggers a chain reaction that gives the perception increasing plausibility through its rising availability in public discourse".Something like: If you repeat a lie often enough, people will start to believe it.
Joseph Goebbels knew that too.
CliSci # 198 2015-03-30
Our Climate and the Motion of the Solar System in the Galaxy
In a study issued as
Nature - Scientific Reports 06150 and freely accessible, Nir Shaviv, Andreas Prokoph and J ¡n Veizer ask the question: "Is the Solar System 's galactic motion imprinted in the Phanerozoic Climate?"
Abstract:
"A new d18O Phanerozoic database, based on 24,000 low-Mg calcitic fossil shells, yields a prominent 32 Ma oscillation with a secondary 175 Ma frequency modulation. The periodicities and phases of these oscillations are consistent with parameters postulated for the vertical motion of the solar system across the galactic plane, modulated by the radial epicyclic motion. We propose therefore that the galactic motion left an imprint on the terrestrial climate record. Based on its vertical motion, the effective average galactic density encountered by the solar system is 0.172 ±0.006stat ±0.006sysMopc-3. This suggests the presence of a disk dark matter component."
We know Shaviv from
his 2002 paper about the Galactic Cosmic Ray diffusion from the galactic spiral arms, affecting our received CR flux as the solar system passes through the spiral arms of the Milky Way, something that seems to have happened with a frequency of six times in the last billion years. The galaxy itself makes one evolution every 230 Ma.
Even for an astrophysicist this new paper would be heavy reading. On
WUWT Kirby Schlaht presents a limited explanation.
Read Salvatore del Prete 's comments on 22/3 at 10:58 am and Dr.Carl Looney 's at 6:45 pm
The Gulf Stream
With the present somewhat desperate publication campaign leading up to the critical Paris COP21 sessions later this year, comes a paper in which two of the greatest alarmists of them all,
Michael Mann and Stefan Rahmstorf try to make a case in Nature Climate Change [$], (abstract only) for a slowing down of the Gulf Stream because of the infusion from non-salty meltwater from the Greenland ice sheet, ignoring a 2014
GRL paper by Rossby et al stating that no changes in Gulf Stream speed have taken place, as did
NASA five years ago.
This has let loose a stream of contrary comment. Wise observations of the
Gulf Stream "myth" (of warming Europe), fears of amok about the breakdown of the AMOC, the Atlantic Meridional Overturning Circulation.
NoTricksZone states that the Rahmstorf/Mann paper did not even survive birth.
GWPF and
WUWT weigh in and everyone has a jolly good time bashing then alarmists. Even Steve Mc Intyre joins in on
ClimateAudit and discovers some booby traps after first observing
"Only one thing can be surmised from Rahmstorf and Mann 's claim that the Mann et al 2008-9 network can be used to reconstruct not just NH temperature, but also SH temperatures and now Atlantic Meridional Overturning Circulation: using Mannian RegEM with the Mann et al 2008-9 network of 1209 proxies , one can probably reconstruct almost anything. Are you interested in reconstructing the medieval Dow Jones Index? Or medieval NFL attendance? "Reductio ad mannium".
It leaves your reporter somewhat befuddled about the sense of it all. In paleoclimate research AMOC disturbance has been fingered as being a contributory influence (at least) for NH cooling, as the influence of Arctic waters would have overturned that Gulf Stream circulation at the latitude of Lisbon.
* Annual Luncheon Meeting
The Annual Luncheon Meeting will be held this year on May 5th and will take the form of a Keynote Speech by Donna Laframboise, entitled "The Road to Paris: Sex, Scandal & the IPCC - - What the Pachauri Scandal Means for Climate Change Policy". It has been organised by the Frontier Centre for Public Policy as their First Annual Luncheon for the Environment and sponsored by the Friends of Science.
The Frontier Centre is able to issue charitable receipts for ticket purchases, ensuring anyone attending the event this year receives a charitable receipt of $55 for their $100 (plus GST) ticket purchase. Profits from this event will be directed toward scholarships and research at Frontier Centre for Public Policy, on climate change, environmental research and education that will be based on credible, peer-reviewed work.
The Decay of Peer Review
In climate science the abuses in the peer review system - on which proper scientific research depends - have been documented and often described as "Pal" review. It can be argued that this distortion of the scientific method is due to a large extent to the nature of "bespoke" research, where it is carried out at the request of government-related and (in-)directly government funded agencies to support policy decisions already crafted. The system does not welcome criticism and open discussion and its politically desired results are amplified by government and turned into government policy.
It should be recognised that the practice has occured on both sides of the climate science fence. Why solicit a known climate sceptic reviewer for a warmist paper and vice versa?
A parallel, though possibly more economically motivated situation has now been described in the bio-medical field.
BioMed Central, publisher of 277 peer-reviewed journals, has rang the bell and retracted 43 papers because of " fabricated' peer reviews amid signs of a broader fake peer review racket affecting many more publications", says
The Washington Post.
Meanwhile, COPE, the Committee on Publication Ethics, a multidisciplinary group that includes more than 9,000 journal editors,
issued a statement suggesting a much broader potential problem. The committee, it said, has become aware of systematic, inappropriate attempts to manipulate the peer review processes of several journals across different publishers. Those journals are now reviewing manuscripts to determine how many may need to be retracted, it said.
See also "
Ignore climate consensus studies based on random people rating journal article abstracts" on <
http://www.joseduarte.com/>
CliSci # 197 2015-03-20
"Surface Radiative forcing by CO2 observed"
A Nature Letter by Feldman et al from Berkeley Labs claims to have finally detected the radiative forcing by atmospheric CO2. The authors acknowledge the theoretical calculation (which gives the tropopausal annual mean of 1.8 W/m2), but say that despite widespread scientific discussion and modelling of the climate impacts of well-mixed greenhouse gases, there has been little direct observational evidence of the radiative impact of increasing atmospheric CO2.
They present observed value from the 2000-2010 period of the impact of the 22 ppm atmospheric CO2 increase during that period, as gathered from the Atmospheric Emitted Radiance Interferometer spectra, showing 0.2 W/m2 per decade of radiative impact. They conclude that these results confirm theoretical predictions of the atmospheric greenhouse effect due to anthropogenic emissions, and provide empirical evidence of how rising CO2 levels, mediated by temporal variations due to photosynthesis and respiration, are affecting the surface energy balance.
Not so fast, physical chemist Dr Siegfried Dittrich seems to say, as reported by Pierre Gosselin 's NoTricksZone blog. The measurements show the opposite of what has been said to be proven, i.e. nothing more than what serious climate critics have always been saying about the anthropogenic GH effect.
Critics point out that the so-called solar constant of 1367 W/m2 deviates already more than the 0.2 W/m2 measured. See next item.
No need for the "The Proof" -hype, as dutifully distributed by the German Online FOCUS, complete with the obligatory cooling towers spewing ..... water vapour.
...... and furthermore:
The Hockey Schtick reports on a new GRL paper by Zhou, Zhang, Bao and Liu "On the Incident Solar Radiation in CMIP5 Models" that finds large calculation errors of solar radiation at the top of the atmosphere, pointing out that "the alleged radiative forcing from all man-made CO2 generated since 1750 is claimed by the IPCC to be 1.68 W/m2. By way of comparison, the up to 30 W/m2 of 'spurious variations' from incorrect calculation of solar zenith angle discovered by the authors is up to 18 times larger than the total alleged CO2 forcing since 1750."
Abstract:
Annual incident solar radiation at the top of atmosphere (TOA) should be independent of longitudes. However, in many Coupled Model Intercomparison Project phase 5 (CMIP5) models, we find that the incident radiation exhibited zonal oscillations, with up to 30 W/m2 of spurious variations. This feature can affect the interpretation of regional climate and diurnal variation of CMIP5 results. This oscillation is also found in the Community Earth System Model (CESM). We show that this feature is caused by temporal sampling errors in the calculation of the solar zenith angle. The sampling error can cause zonal oscillations of surface clear-sky net shortwave radiation of about 3 W/m2 when an hourly radiation time step is used, and 24 W/m2 when a 3-hour radiation time step is used.
See also on WUWT.
Trenberth 's Missing Heat - hiding in the deep oceans
As Kevin Trenberth floated the hypothesis that the missing heat was hiding in the deep oceans, he raised a lot of questions about "Vertical redistribution of oceanic heat content".In an article by that title in the AMS ' Journal of Climate by Liang, Wunsch, Heimbach and Forget (preprint) this strange notion is put to rest.
Abstract:
Estimated values of recent oceanic heat uptake are of order of a few tenths of a W/m2, and are a very small residual of air-sea exchanges with annual average regional magnitudes of hundreds of W/m2. Using a dynamically consistent state estimate, the redistribution of heat within the ocean is calculated over a 20-year period. The 20-year mean vertical heat flux shows strong variations in both the lateral and vertical directions, consistent with the ocean being a dynamically active and spatially complex heat exchanger. Between mixing and advection, the two processes determining the vertical heat transport in the deep ocean, advection plays a more important role in setting the spatial patterns of vertical heat exchange and its temporal variations. The global integral of vertical heat flux shows an upward heat transport in the deep ocean, suggesting a cooling trend in the deep ocean. These results support an inference that the near-surface thermal properties of the ocean are a consequence, at least in part, of internal redistributions of heat, some of which must reflect water that has undergone long trajectories since last exposure to the atmosphere. The small residual heat exchange with the atmosphere today is unlikely to represent the interaction with an ocean that was in thermal equilibrium at the start of global warming. An analogy is drawn with carbon-14 reservoir ages which range over hundreds to a thousand years.
Much comment with Tisdale 's review in WUWT (don 't miss the NOAA SST Anomalies video in the comments at 14/3 at 7:59 am and look at the Ni ±o/Ni ±a interplay) and in Talbloke 's Talkshop .
Keeping track of the weather
Further to the oceanographic video, mentioned above, the following:
As the various print, audio and electronic media are dumbing down daily weather coverage in order to reach more dumb people and save money on using knowledgable live bodies, today 's newspapers, radios and TV screens offer you little more than temperature data processed in various formats. I would imagine readers of this newsletter generally would like to know just a bit more. I like to share with you a number of my personal sources:
<http://www.stormsurfing.com/cgi/display_alt.cgi?a=glob_250> gives you running account of the behaviour of the Jet Stream over the next 180 hours.<http://www.eldoradocountyweather.com/canada/forecast-maps/jetstream.html> is probably one of the most comprehensive summaries of current weather elements anywhere.<http://wattsupwiththat.com/reference-pages/> also covers in 24 pages most measuring sticks that make up "climate". Take some time to explore these sites and pick your own favourites.
GWPF responds to the RS publication
Temperature measurement
There has been a continuing argument about the differences between the various types and sources of temperature measurement. Bob Tisdale continues his periodic posts that analyse the causes for the differences in data and trends, as well as some of the manipulations that have taken place (mostly to push down historical data in order to increase the apparent "warming trend").
HERE he deals with GISS, NCDC, and HADCRUT4 surface data, the two satellites RSS and UAH and the IPCC 's product, CMIP5 archive.
Thorium Reactor Symposium
It has been acknowledged for decades that a sustainable Thorium-based Nuclear Reactor could be feasible and practical as a reliable, clean and safe energy alternative without military application possibilities. The reasons why we do not have any by now range from the technical to the conspiratorial.
There are many scientists working on the concept of the Molten Salt Reactor in laboratories around the world. They will
assemble on April 17th at the Technical University at Delft to discuss the progress at a symposium. One should know about Thorium. The above hyperlinked page has an Information Bar that will lead you to answer to your questions, specifically the
MSR section.
A G4 Intensity Geomagnetic Storm
Dr. Roy Spencer 's blog carries
four photographs of this week 's aurora event, which is being described by many as the most spectacular of this solar cycle, resulting from a severe geomagnetic storm (G4 intensity) as a coronal mass ejection from the sun hit the upper atmosphere.
New photos of the event continue to pour in from around the world at the SpaceWeather.com aurora photo gallery.
CliSci # 196 2015-03-10
Rise and fall of "Kyoto" as a political process
"There is a story about the town elders of the city of London, according to which the increasing traffic at the end of the 19th century caused them great worries. The metropolis had 11,000 hansom cabs, and on top of that horse-drawn buses and even trams. And since one horse generated some 6 to 12 kilos of manure a day, it was calculated that very soon the inhabitants of the city would be forced to wade through horse manure, which was up to their knees or even higher. According to the story, an article was published in the London Times in 1894, in which it was estimated that a manure layer of three metres would cover the streets of London by 1950. This massive horse manure dilemma which would, besides being an aesthetic problem, also cause problems with odour, health and hygiene was even discussed at the first International Urban Planning Conference in New York in 1898, but no results were obtained, however. The future seemed to be problematic, and the issue was not solved until new kinds of horsepowers came about along with their unprecedented problems."
Thus begins the Preface/Abstract of the 400 page 2014 Dissertation by Eija-Riitta Korhola at the University of Helsinki.
Korhola is a Finnish politician and former member of the Finnish and European Parliaments, who has been involved in the Kyoto process through the years. She is giving a blow-by-blow description of all problems that surround it, except for the critical scientific detail (We are getting enough of that anyway).
Nevertheless, the author breaks a lance for the preservation of the epistemic approach of the science and warns scientists to stay out of advocacy involvement.
Being a thesis, it is well annotated, indexed and referenced. I am not suggesting that you start reading the 400 pages, but I recommend you have a look at the Contents, the Preface and the Afterword (Ch.10) and see whether you want to go any further. It 's a free download.
"The Sun is the Climate Pacemaker"
This is the title of two papers by David Douglas and Robert Knox in Physics Letters A, [$] HERE and HERE which are reviewed in Reporting ClimateScience.
Combined abstracts:
"Equatorial Pacific Ocean temperature time series data contain segments showing both a phase-locked annual signal and a phase-locked signal of period two years or three years, both locked to the annual solar cycle. Three such segments are observed between 1990 and 2014. It is asserted that these are caused by a solar forcing at a frequency of 1.0 cycle/yr. The analysis makes use of a twelve-month filter that cleanly separates seasonal effects from data. This is found to be significant for understanding the El Ni ±o/La Ni ±a phenomenon.
These periodic features are also found in global climate data.
The second paper extends the study to the global ocean, from surface to 700 and 2000 m. The same phase-locking phenomena are found. The El Ni ±o/La Ni ±a effect diffuses into the world oceans with a delay of about two months."
There is however a large body of opinion that holds that the periodic Ni ±o/Ni ±a events are not really cyclical but rather episodical.
The morning fog of Southern California
On the AGU blog GeoSpace Larry O 'Hanlon reports on a GRL paper by Lamont/Doherty 's Park Williams that states that the urban heat of paved-over, developed coastal Southern California is playing havoc with the early summer "June Gloom", the incoming Pacific fog that wets vegetation in this dry area. Temperature data are taken from airfields.
It is held that urban warming is driving the cloud bases upward, deprives vegetation from its regular moisture supply and changes the microclimate. Less fog is bad news for native plants in the coastal hills and mountains, which depend on the cool fog as their only source of water during the rainless summer months. An increase in forest fires may be another consequence.
It being an AGU article, the writer makes the obligatory nod to Global Warming before signing off.
'CO2Science'
The Idso family of climatologists, Craig, Sherwood and Keith, has been a mainstay of independent climate research for many years. Their <http://www.co2science.org/> website is always worth visiting. They also publish a free newsletter. A number of recent scientific articles reviewed by them mostly deal with Holocene climate studies:
2500 Years of Northern South China Sea Surface Temperatures
by Yan, H., Soon, W. and Wang, Y. 2015. A composite sea surface temperature record of the northern South China Sea for the past 2500 years: A unique look into seasonality and seasonal climate changes during warm and cold periods. Earth-Science Reviews 141: 122-135., Mar 3, 2015
These procedures led to their determining that the SSTs of 80-year warm-period time-windows centered on AD 990 and AD 50 were 0.89 °C and 1.55 °C higher than those of the instrumental period of AD 1990-2000.
The Medieval Warm Period in West Greenland 's Disko Bugt Area
by Ouellet-Bernier, M.-M., de Vernal, A., Hillaire-Marcel, C. and Moros, M. 2014. Paleoceanographic changes in the Disko Bugt area, West Greenland, during the Holocene. The Holocene 24: 1573-1583. Mar 2, 2015
These efforts revealed the existence of a number of periods of alternating cold and warm sea surface temperatures (SSTs) throughout the Holocene, the last of which warm periods was the Medieval Warm Period that occurred between approximately 1000 and 800 years BP. And in reporting their findings, Ouellet-Bernier et al. say that during this period the region 's summer SSTs increased to about 10 °C, which they describe as being much higher than the present day summer SST of about 4.4 °C at the coring site, as recorded in the World Ocean Database of the NODC (2001).
An 1860 to 2012 History of Storminess in Northern Denmark
by Clemmensen, L.B., Hansen, K.W.T and Kroon, A. 2014. Storminess variation at Skagen, northern Denmark since AD 1860: Relations to climate change and implications for coastal dunes. Aeolian Research 15: 101-112. Feb 27, 2015
'between 1860 and 1875 storminess (wind events exceeding Beaufort 8) is extremely high, but since then storminess decreases. And they note that, concomitantly, around 1870 the annual drift potential (DP) of coastal dunes was also extremely high and reaches up to 9600 vector units (VU, knots). But they say that since 1980 DP levels are below 3000 VU and decreasing, which significant shift in wind climate towards less storminess is seen at a number of stations in NW Europe.
A Three-Decade History of Australian Region Tropical Cyclones
by Dowdy, A.J. 2014. Long-term changes in Australian tropical cyclone numbers. Atmospheric Science Letters 15: 292-298.
And so we would appear to have another example wherein the claims of proponents of CO2-induced increases in the number of occurrences of various extreme weather events do not appear to jibe with what is observed in the real world of nature.
The Polar Vortex in the mid-19th century
Paul Homewood was digging into a 1995 book by early climatologist and CRU founder (1972!) Hubert Lamb who noted the meridionality of wind circulation during the 19th century and possible parallels with LIA phases. Lamb, who died in 1997 would have recognised what is happening today.
CTV News reports that Eastern Ontario/Western Quebec had February temperatures that were the coldest in 115 years.
At the last minute:
Two items in WUWT last night:
* A PNAS paper discovers a link between Cosmic Rays and Global Temperature, ten years after Svensmark, but decides to find it wanting.
CliSci # 195 2015-02-28
With Chris Essex Down the Rabbit Hole'
Dr Chris Essex (Un. W. Ontario, London ON) gave a lecture for GWPF in London UK, about "Believing in Six Impossible Things Before Breakfast, and Climate Models" and other shibboleths of our culture.
The second half concentrates on the computer 's ability to represent actual mathematical and physics situations. Laws of Physics when written for processing by what he calls the numerical monster ' often fail in providing clear solutions. When applied to parameterised climate problems, things fall apart.
Look at the video; it will be an hour well spent.
<https://www.youtube.com/watch?feature=player_embedded&v=19q1i-wAUpY>
Michael Mann Explains the Pause
Steinman, Mann and Millar report in Science 347/6225 [$] on "Atlantic and Pacific multi-decadal oscillations and Northern Hemisphere temperatures" in an obvious attempt to explain away the bothersome GW slowdown as a "faux pause" in the unavoidable march towards CAGW. They say it's due to interaction of the AMO and PDO oscillations.
Abstract:
"The recent slowdown in global warming has brought into question the reliability of climate model projections of future temperature change and has led to a vigorous debate over whether this slowdown is the result of naturally occurring, internal variability or forcing external to Earth 's climate system. To address these issues, we applied a semi-empirical approach that combines climate observations and model simulations to estimate Atlantic- and Pacific-based internal multi-decadal variability (termed AMO and PMO, respectively). Using this method, the AMO and PMO are found to explain a large proportion of internal variability in Northern Hemisphere mean temperatures. Competition between a modest positive peak in the AMO and a substantially negative-trending PMO are seen to produce a slowdown or false pause in warming of the past decade."
A Guardian report quoted by Tallbloke states "Manmade global warming over the past decade has probably been partly offset by the cooling effect of natural variability in the Earth 's climate system, a team of climate researchers have concluded. The finding could help explain the slowdown in temperature rises this century that climate sceptics have seized on as evidence climate change has stopped, even though 14 of the 15 hottest years on record have happened since 2000."
Co-author Michael Mann: "Our conclusion that natural cooling in the Pacific is a principal contributor to the recent slowdown in large-scale warming is consistent with some other recent studies, including a study I commented on previously showing that stronger-than-normal winds in the tropical Pacific during the past decade have lead to increased upwelling of cold deep water in the eastern equatorial Pacific .
Says Tallbloke:"The idea that natural variation could make temperatures go up as well as down is still not for discussion in their biased climate world."
It is encouraging that a group that includes Michael Mann will now pay such homage to natural forces. Two things though, that we have to remind them of:
1. Oceanic oscillations such as the AMO and PDO move in tandem in a ~ 60 year cyclic pattern, albeit with a multi-year delay between them. So far they have been the dominating climate influence of the past 150 years. Nothing to do with the cherished greenhouse.
2. There is a clear connection between the Atlantic oscillations and the solar magnetic radiation variation, as expressed by the deviation caused by the solar wind received Galactic Cosmic Ray flux (cloud cover) and temperature as seen HERE .
Interactions between the PDO and AMO are not the cause.
The tail does not wag the dog.
It's the sun, Michael. The oceans are the main interlocutor.
Pachauri 's Exit
Shortly after having been accused of sexual harassment, the IPCC Chairman has made a premature departure. Donna Laframboise says his resignation letter is a two page love letter to himself: <http://www.ipcc.ch/pdf/ar5/150224_Patchy_letter.pdf> which closes with: "For me the protection of Planet Earth, the survival of all species and sustainability of our ecosystems is more than a mission. It is my religion and my dharma."
In a Press Release the GWPF complains about the IPCC 's increasing lack of scientific objectivity and calls on Governments to "overhaul the missionary ' IPCC", tying in to its now past-Chairman 's resignation letter.
Friends of Science issues a Press Release.
They Finally got to Willie ....
In 2003 Harvard/Smithsonian astrophysicists Sallie Baliunas and Willie Soon severely disturbed the Michael Mann myth, which held that the Medieval Warming Period was a local Northern Hemisphere occurrence, by proving that it had been a world wide event and warmer than the present warming period. Baliunas also pointed to the Little Ice Age as likely having had a natural cause, as it coincided with a pronounced solar radiation minimum. They thus attacked the conclusions of the MBH99 study (Mann et al) and thereby the hockey stick ' graph which the IPCC had started to push in its Assessment Report.
Sallie Baliunas, one of America 's foremost women scientists at the time, was driven out of Harvard and gave up her profession for a rural life in upstate Massachusetts. (You can still see many of her presentations HERE on YouTube, as well as her slides HERE on the FoS site). Willie Soon survived', becoming increasingly critical of the IPCC line, until the modelling paper he published with Monckton, Legates and Briggs (see CliSci # 193, item 1) caused him being pushed into the ranks of the unemployed as well. Harvard, dominated for years by Obama 's Science Advisor John Holdren, did not take well to attacks on the government-supported science.
Two scribblers in the NYTimes finished the hatchet job.
In Breitbart James Delingpole describes recent developments.
A Civilised Debate
NARUC, a US organisation of Utilities Regulators invited Georgia Tech 's Dr Judith Curry to a one-on-one panel discussion with - luke warmer - Dr Joe Casola (Center for Climate and Energy Solutions). The format was one of ten minute opening statements, followed by seven set questions.
As it happened Judith ' flight was cancelled because of snow storms and she found herself participating by telephone from an airport lounge, with the organisers projecting her slides at the meeting as she went along.
Her report on the event is HERE and Casola's power point presentation is HERE. Judith has also made her slides available.
It is hard enough to get CAGW believers to enter into debate at all and such confrontations between CAGW believers and sceptics usually result in a dialogue of the deaf. Civilised debates are rare and usually only succeed when there are firm rules, set topics and a confident moderator.
Surface Radiative Forcing
Feldman and colleagues (Berkeley Lab) in an preview article in Nature Febr.25 (14240) [$] discuss "Observational determination of surface radiative forcing by CO2 from 2000 to2010" and find it directly attributable to the 22 ppm atmospheric CO2 increase.
Abstract:
"The climatic impact of CO2 and other greenhouse gases is usually quantified in terms of radiative forcing1, calculated as the difference between estimates of the Earth 's radiation field from pre-industrial and present-day concentrations of these gases. Radiative transfer models calculate that the increase in CO2 since 1750 corresponds to a global annual-mean radiative forcing at the tropopause of 1.82 ± 0.19 W m ˆ’2 (ref. 2). However, despite widespread scientific discussion and modelling of the climate impacts of well-mixed greenhouse gases, there is little direct observational evidence of the radiative impact of increasing atmospheric CO2. Here we present observationally based evidence of clear-sky CO2 surface radiative forcing that is directly attributable to the increase, between 2000 and 2010, of 22 parts per million atmospheric CO2. The time series of this forcing at the two locations the Southern Great Plains and the North Slope of Alaska are derived from Atmospheric Emitted Radiance Interferometer spectra3 together with ancillary measurements and thoroughly corroborated radiative transfer calculations4. The time series both show statistically significant trends of 0.2 W m ˆ’2 per decade (with respective uncertainties of ±0.06 W m ˆ’2 per decade and ±0.07 W m ˆ’2 per decade) and have seasonal ranges of 0.1 0.2 W m ˆ’2. This is approximately ten per cent of the trend in downwelling longwave radiation5, 6, 7. These results confirm theoretical predictions of the atmospheric greenhouse effect due to anthropogenic emissions, and provide empirical evidence of how rising CO2 levels, mediated by temporal variations due to photosynthesis and respiration, are affecting the surface energy balance."
The article is discussed in Science Daily and panned in the Hockeyschtick by Steven Goddard and others who conclude "The claim that the warming 2000-2010 is from CO2 confuses cause with effect. Warming of the atmosphere due to internal variability, ocean oscillations, cloud cover changes, solar amplification mechanisms, etc. secondarily warm the CO2 in the atmosphere increasing the 15 micron IR radiation observed from increased levels of CO2."
On WUWT, Anthony Watts agrees with some of it but cautions: "What is really the issue related to AGW claims are the posited/modeled but not observed feedbacks and the logarithmic (not linear) saturation curve response of CO2. Along those lines, eyeballing the graph presented from the north slope of Alaska, it appears there might be a bit of a slowdown or pause in the rate of forcing from about 2007 onward. Hopefully, LBL will release the data for independent analysis."
CliSci # 194 2015-02-20
Arctic versus Antarctic
A new article in WUWT by Dr Tim Ball discusses the causes of the climate differences between the earth 's North and South Poles.
Restless Earth: Inner Core geophysics
Wang, Song and Xia have a 2015 paper in Nature Geoscience [$] entitled "Equatorial anisotropy in the inner part of Earth 's inner core from autocorrelation of earthquake coda", which is reported on in PSI by BBC Science Correspondent Rebecca Morelle.
What this mouthful is about is the attempt to get better definition of the earth inner core through analysis of the natural seismic waves caused by earthquakes. The result of their analysis points to the moon-sized inner core itself having an "inner inner core" and an "outer inner core", which are differentiated by the orientation of iron crystals, roughly East-West in the inner part, and North-South in the outer one.
Tracing the development of the core back in time Professor Song points to "the strange paleomagnetic signatures from ancient rocks" that would indicate a relationship with the switch in the earth magnetic axis half a billion years ago, from equatorial to polar.
Some of this is part of a project which has been ongoing for years. Is it an indication of a connection between the earth ' magnetism and its surroundings?
Joe Olson comments in PSI: "I have since reviewed the material at "Electric Universe" and agree that Earth's magnetism is related to solar and cosmic magnetism, and that this giant permanent magnet core is in a generator-motor connection to the galactic system. I still maintain that variation in magnetic strength and axis declination are the result of the necessary permanent magnetic effect of dipolar Iron, forced into a cubic crystal matrix."
More on this in Space Daily:"Geologists unlock mysteries of the planet's inner core".
Solar Cycle and Temperature Updates
David Archibald provides the complete updated set of charts tracking the progress of SC 24 on WUWT.
Bob Tisdale gives a "Global Surface (Land+Ocean) and Lower Troposphere Temperature Anomaly & Model-Data Difference Update, as of January 31, also in WUWT.
The Sun and the Oceans
Frank Bosse and Fritz Vahrenholt have an article in die Kalte Sonne which can be found in English translation by the untiring Pierre Gosselin as the fourth item on this NoTricksZone blog: The Sun in January 2015 and Atlantic prognoses.
The - low - double peak of SC 24 maximum is now past, as is even more clear from the levelling out of the strengths of the two polar magnetic fields.
Following up on an earlier paper in Die kalte Sonne in which the authors analyse changes in the Atlantic oceanic oscillations NAO (North Atlantic Oscillation), AMO (Atlantic Multidecadal Oscillation) and the consequences for the AMOC (Atlantic Meridional Overturning Circulation), the new paper makes connections between the reduced solar radiation and the temperature of the Northern Hemisphere as empirically linked by the AMOC.
This research, reportedly ignored by IPCC, has some way to go, but it should alert one to evidence of similar connections reported from the rapid changes at the time of the Dryas/Aller ¸d flip-flops some 13,000 years ago.
CO2 and the Oceans
An international group headed by Martinez-Boti and Marino is reporting in a Nature letter [$] on Boron isotope evidence in the behaviour of oceanic carbon over time, specifically in connection with glacial/interglacial transitions. (Nature letter, 518, ˆ’14155-; pp 219-222). An article on their report appeared appeared in Daily Mail Online
From the abstract and introductory paragraphs:
"The modern Southern Ocean is a region of vigorous upwelling of carbon- and nutrient-rich waters. Much of the upwelled CO2 is outgassed to the atmosphere, owing to incomplete nutrient utilization in the Southern Ocean surface. These waters are then re-subducted as intermediate waters and feed the thermocline of the low-latitude oceans, such as the eastern equatorial Pacific Ocean, which is at present one of the main oceanic sources of CO2 to the atmosphere. Many of the mechanisms proposed to reduce atmospheric CO2 during glacial periods focus on a reduction of Southern Ocean CO2 leakage, via increased ocean stratification or a more efficient biological pump (probably boosted by iron fertilization), or both. During deglaciation, this situation is reversed, and previously isolated deep-ocean carbon is thought to be upwelled and re-exposed to the atmosphere."
[.......]
"The boron isotope pH proxy in planktic foraminifera has been applied to two sediment cores from the sub-Antarctic Atlantic and the eastern equatorial Pacific as a more direct tracer of oceanic CO2 outgassing. We show that surface waters at both locations, which partly derive from deep water upwelled in the Southern Ocean, became a significant source of carbon to the atmosphere during the last deglaciation, when the concentration of atmospheric CO2 was increasing. This oceanic CO2 outgassing supports the view that the ventilation of a deep-ocean carbon reservoir in the Southern Ocean had a key role in the deglacial CO2 rise, although our results allow for the possibility that processes operating in other regions may also have been important for the glacial interglacial ocean atmosphere exchange of carbon."
----------------
The study of ocean perturbations over time is interesting, but the authors seem to be unable to free themselves from the IPCC 's preferred dogmatic take on the CO2 question when they discuss outgassings with atmospheric CO2 content and global temperature changes.
Sorry, I forgot: That science has been settled.....
CliSci # 193 2015-02-10
The Simpler Climate Model with a Pocket Calculator
A foursome consisting of Lord Monckton, Willie Soon, David Legates and William Briggs have published an article explaining their simple climate sensitivity model.
Abstract:
An irreducibly simple climate-sensitivity model is designed to empower even non-specialists to research the question how much global warming we may cause. In 1990, the First Assessment Report of the Intergovernmental Panel on Climate Change (IPCC) expressed "substantial confidence" that near-term global warming would occur twice as fast as subsequent observation. Given rising CO2 concentration, few models predicted no warming since 2001. Between the pre-final and published drafts of the Fifth Assessment Report, IPCC cut its near-term warming projection substantially, substituting "expert assessment" for models' near-term predictions. Yet its long-range predictions remain unaltered. The model indicates that IPCC's reduction of the feedback sum from 1.9 to 1.5 W m-2 K-1 mandates a reduction from 3.2 to 2.2 K in its central climate-sensitivity estimate; that, since feedbacks are likely to be net-negative, a better estimate is 1.0 K; that there is no unrealized global warming in the pipeline; that global warming this century will be < 1 K; and that combustion of all recoverable fossil fuels will cause < 2.2 K global warming to equilibrium. Resolving the discrepancies between the methodology adopted by IPCC in its Fourth and Fifth Assessment Reports that are highlighted in the present paper is vital. Once those discrepancies are taken into account, the impact of anthropogenic global warming over the next century, and even as far as equilibrium many millennia hence, may be no more than one-third to one-half of IPCC's current projections.
Says Lord Monckton: "What is new is the demonstration that one can use a very simple model and, using honest and physically-appropriate values for its parameters, obtain less absurd and exaggerated estimates of climate sensitivity than the general-circulation models. Also, what is new is that for the first time the principal elements in the determination of climate sensitivity are made publicly available in a very short compass, and yet with full discussion of the individual equations and parameters and of the interactions between them. It has never been done this clearly or this concisely before. We have done our level best to make the notion of climate sensitivity and of the uncertainties in its determination as widely accessible as possible."
The article itself is downloadable as a PDF from the (Chinese) Science Bulletin V 60/1, or possibly more easily HERE from Briggs ' website.
Extensive and sharp discussions are on WUWT. They carried on for days, in which Monckton also replies that their article is not so much an explanation of climate behaviour as an exercise to explain the errors of the IPCC 's modelling approach. He acknowledges a minor CO2 influence. Their model uses 1 «K per CO2 doubling. A duel between Monckton and Svalgaard ensued.
The alarmist CAGW-ers have often challenged the sceptics to produce their own model, one that will do better than their GCMs.
Has that challenge been met?
Plugging Holes in the Models: It 's the Wind that did it.
The abstract of a paper ($) by Diane Thompson et al in Nature Geoscience concedes that "Of the rise in global atmospheric temperature over the past century, nearly 30% occurred between 1910 and 1940 when anthropogenic forcings were relatively weak1. This early warming has been attributed to internal factors, such as natural climate variability in the Atlantic region, and external factors, such as solar variability and greenhouse gas emissions. However, the warming is too large to be explained by external factors alone and it precedes Atlantic warming by over a decade. For the late twentieth century, observations and climate model simulations suggest that Pacific trade winds can modulate global temperatures2, 3, 4, 5, 6, 7, but instrumental data are scarce in the early twentieth century."
The paper then presents a band-aid solution (a model to fix the model) to keep the GCM alive, rather than questioning its basic assumptions:
"Here we present a westerly wind reconstruction (1894 1982) from seasonally resolved measurements of Mn/Ca ratios in a western Pacific coral that tracks interannual to multidecadal Pacific climate variability. We then reconstruct central Pacific temperatures using Sr/Ca ratios in a coral from Jarvis Island, and find that weak trade winds and warm temperatures coincide with rapid global warming from 1910 to 1940. In contrast, winds are stronger and temperatures cooler between 1940 and 1970, when global temperature rise slowed down. We suggest that variations in Pacific wind strength at decadal timescales significantly influence the rate of surface air temperature change."
Messing with Data
A number of articles are now hitting the media about the IPCC 's practice to bend data series to its hypothesis, probably because of the disputed claim that 2014 would have been the warmest year yet. Here are some:
The IPCC succession
With Dr Pachauri at the end of his term, several candidates have emerged to serve as IPCC Chairman. First among those is Professor Jean-Pascal van Ypersele (Catholic University of Louvain, Belgium) who at present is one of the Vice-Chairs. The Belgian government has supported Van Ypersele 's candidacy.
The IPCC is at a critical time of its history. Doubt about its climate projections is spreading (particularly now that no warming has taken place in 16 years), the general economic slowdown is playing havoc with EU governments carbon ' policies and the Paris Conference later this year is expected to be marred by much foot-dragging, hypocrisy and escape clauses.
The prospect of Van Ypersele's succession has upset some of his Louvain colleagues as well as other professionals in the country who know him as one who, in their opinion, has continuously blocked debate, and even freedom of speech and has used bullying and inflammatory language with respect to IPCC critics, an ex-Greenpeace worker, who calls sceptics the equivalent of "Deniers" and strives to limit academic freedoms. His rigidity and bias would be unwelcome in the coming term.
In late January seven of his critics issued a rather explicit Communiqu that asked the Belgian government to review its previous support for his candidacy. The seven called him a "radical ecological militant". This request was reproduced in several Belgian and Dutch newspapers, among which the large Flemish daily "De Standaard". It was followed by a background article by Editor Minten and such cabal from comments by warmists groups, plus an official complaint, that the paper 's Ombudsman deemed it necessary to intervene in the matter. The Ombudsman reported that the (anonymous) complainant expressed the view that anyone who is not a climate scientist should not be given a voice. The complainant suggested that these esteemed European academics, scholars, scientists, engineers must sit by silent simply because they are not 'climate scientists '.
At this point the Friends of Science got up on their hind legs and submitted their views to the Ombudsman, mostly in protest to limiting debate, particularly in such a multi-discipline interdisciplinary group of science subjects as Climate Science. Apart from the fact that science methodology, principles and ethics go far beyond the limitations of the immediate group of subjects.
We have summarised this story on the Friends of Science blog site , where it includes our response to the De Standaard 's Ombudsman, both in Dutch and in English.
CliSci # 192 2015-01-30
Sami Solanki 's Sun
In Astronomy and Astrophysics 's Annual Review, Solanki writes a Pay-walled article "Solar Irradiance Variability and Climate", for those who still believe in the "Solar Constant".
Abstract:
"The brightness of the Sun varies on all timescales on which it has been observed, and there is increasing evidence that this has an influence on climate. The amplitudes of such variations depend on the wavelength and possibly the timescale. Although many aspects of this variability are well established, the exact magnitude of secular variations (going beyond a solar cycle) and the spectral dependence of variations are under discussion. The main drivers of solar variability are thought to be magnetic features at the solar surface. The climate response can be, on a global scale, largely accounted for by simple energetic considerations, but understanding the regional climate effects is more difficult. Promising mechanisms for such a driving have been identified, including through the influence of UV irradiance on the stratosphere and dynamical coupling to the surface. Here, we provide an overview of the current state of our knowledge, as well as of the main open questions."
Revisiting Milankovitch
WattsUp 's regular Willis Eschenbach was brought to look at the Ice Ages in terms of changing NH summer insolation and found that things did not always match Milankovitch as neatly as he would have expected.
Even more basically, he was looking for insolation patterns associated with the ~100k pattern of glacial reversals and could not find them and the 100k year eccentricity would not provide the amount of insolation that would get us as rapidly out of an ice age as it actually did. The idea of orbit control of the Ice Ages dates back to the 19th century (Sir Robert Ball, 1891), but it was Milankovitch who spent a lifetime in the pre-computer era, carefully calculating the influence of orbit eccentricity, obliquity and precession cycles over some 600k years.
The topic resulted in one of the more interesting discussions in WUWT of recent months in which some of the heavy hitters in the sceptics' world took part, as well as some barely disguised warmists (spot them when they start talking about the "solar constant" or CO2). I will not attempt to summarise all this.
Have a look at "WUWT-Into and out of the icebox" and take your time. Eschenbach came back for a sequel a day later "The Ice-box heats up" and after reading the comments you would want to forget everything you ever learned about Milankovitch. But now what?
Earthquakes and the solar system - a work in progress
Tying major earthquakes (magnitudes greater than 7) to occurrences in the solar system has always been a bit of a stretch for this geologist. Nevertheless correlations with the PDO seem to exist and the Length Of Day record reflects them also. Scafetta and Mazzarello have a paper in Natural Hazards which looks at Spectral coherence between climate oscillations and the earthquake record; Correlation coefficients range from 0.51 to 0.95, the latter in the 1910-1970 period.
The paper is discussed in Tallbloke 's blog.
The Abstract reads:
"We compare the NOAA Significant Earthquake Historical database versus typical climatic indices and the length of the day (LOD). The Pacific Decadal Oscillation (PDO) record is mainly adopted because most of the analyzed earthquakes occurred at the land boundaries of the Pacific Plate. The NOAA catalog contains information on destructive earthquakes. Using advanced spectral and magnitude squared coherence methodologies, we found that the magnitude M ‰¥7 earthquake annual frequency and the PDO record share common frequencies at about 9-, 20-, and 50- to 60-year periods, which are typically found in climate records and among the solar and lunar harmonics.
The two records are negatively correlated at the 20- and 50- to 60-year timescales and positively correlated at the 9-year and lower timescales. We use a simple harmonic model to forecast the M ‰¥7 significant earthquake annual frequency for the next decades. The next 15 years should be characterized by a relatively high M ‰¥7 earthquake activity (on average 10 12 occurrences per year) with possible maxima in 2020 and 2030 and a minimum in the 2040s. On the 60-year scale, the LOD is found to be highly correlated with the earthquake record (r=0.51 for 1900 1994, and r=0.95 for 1910 1970). However, the LOD variations appear to be too small to be the primary earthquake trigger. Our results suggest that large earthquakes are triggered by crust deformations induced by, and/or linked to climatic and oceanic oscillations induced by astronomical forcings, which also regulate the LOD." It would appear these astronomical forcings would likely be orbital. Other papers have suggested that influences by the earth 's core may also be involved.
Arctic Ice cover: up, down or sideways?
A post in WUWT deals with how Dr Mark Serreze 's the 2009 doom predictions of the Ice Data Center have been faring. Since satellite data became available in the late seventies the square kilometre-based ice record of the Arctic Ocean has shown a downward trend which has continued to the date when Serreze made his forecast. Bringing this chart up to date shows us another hiatus/standstill/pause that has now lasted for seven years. The turning point is 2008.
It is interesting to speculate what this means. The end of the millenium has seen things happen. The sun is leaving its Grand Maximum phase, a phase reversal of the solar dynamo 's behaviour is tied to that and we are leaving a positive phase of the PDO/AMO, which may have been responsible for greater Pacific and Atlantic inflow into the Arctic of warmer water. However, an article by Swart, Fyfe et al (of the Canadian Centre for Climate Modelling and Analysis) in Nature Climate Change is unrepentant and explains things away by saying: "Internal climate variability can mask or enhance human-induced sea-ice loss on timescales ranging from years to decades. It must be properly accounted for when considering observations, understanding projections and evaluating models."
The IPCC 's Canadian Climate model has acquired a reputation of having produced the worst of the IPCC 's temperature models. It also has not been a good year for Polar Bear prognosticators. Last summer Serreze and some colleagues had an embarrassing meeting with the IUCN 's Polar Bear specialist group, which you better read for yourselves.
CliSci # 191 2015-01-20
'The deliberate corruption of Climate Science'
The essence of his recent book by this title is presented by author Dr Tim Ball in this video, from a talk at Mt Vernon WA on last May 30th:
<https://www.youtube.com/watch?feature=player_embedded&v=Owm25OHGglk>
Old Hypes never die; they just grow sillier
Under the title "Probabilistic reanalysis of twentieth century sea-level rise" Harvard-based Hay, Morrow et al re-analyse, re-hash, and employ "different methods to accommodate the spacial sparsity and temporal incompleteness" and "constrain the geometry of long term sea-level change" and conclude that acceleration in sea level rise is "worse than we thought". The article in Nature shows faith in something called the Global Mean Sea Level (better than Global Mean Temperature?), and adjusts some historic data downward, saying things like " The failure to close the budget of GMSL during this period has led to suggestions that several contributions may have been systematically underestimated".
It is mercilessly being torn apart and reviewed in WUWT.
Reconsidering Ocean Calamities and the Journals
Carlos Duarte and seven international co-authors write in Bioscience that the world 's oceans are suffering from a proliferation of a number of pressures, a growing concern that the state of the oceans is compromised, which is driving society into pessimism. They argue that proper scrutiny of claims of calamities and disruptive changes is required to deliver a more precise diagnosis and that an ongoing audit is required.
See also Tisdale in WUWT.
The article is taken up by Nature/news , where Daniel Cressey agrees that there is much group-think, that challenges are overstated and claims not always based on observations.
Duarte 's group places some of the blame for the hype at the door of some journals, including Nature. The appetite of the media for particular headlines can influence the contents of top scientific journals, they write.
Philip Campbell, Nature's editor-in-chief, (which is separate from its Nature/News section) disagrees. We select research for publication in Nature on the basis of scientific significance." [....] That in turn may lead to citation impact and media coverage, but Nature editors aren't driven by those considerations, and couldn 't predict them even if they wished to do so. (Who? .....Us?)
* Belgian scientists request their Government pass on IPCC candidate
The Friends of Science are supporting a group of Belgian academics who have sent an open request to their Council of Ministers giving a number of compelling reasons why their compatriot Jean-Pascal van Ypersele should not receive their backing as candidate for the post of IPCC President.
They claim that Van Ypersele sees critics of the IPCC as negationists (~Deniers), considers their articles as "criminal against society", refuses to engage in debate, intervened in having a science colloquium with Professor Singer prohibited from taking place and close by saying that "accession to the Presidency of this radical ecological militant could only lead to further politicisation and poisoning of a debate that is in need of serenity."
The "Request" is HERE in the original Dutch/Flemish and HERE in English translation.
* "Burning Questions" on the "Alberta "Phase-out Coal" Campaign
The Friends of Science have prepared an 40-odd page evidence-based review of the report by the Pembina Institute ("A costly Diagnosis: Subsidizing Coal Power with Albertans ' Health") a computer model-based assessment of health-illness issues, which does not use actual patient records and which misrepresents the facts about coal-fired power plant emissions, exaggerating them by 15 fold.
One of the issues is the presumed significant amount of PM2.5 emissions from coal burning (particulate matter smaller than 2.5 micron) which is totally invalidated by proper comparison with other sources, such as wildfires, road dust, construction, agriculture and even residential fireplaces. These figures will surprise you.
Alberta 's coal-fired power plants use pulverized coal for more complete burn and reduced emissions. Alberta has two advanced supercritical coal-fired plants, which filter 99.8% of PM2.5 emissions. All earlier model coal-fired power plants are equipped with emissions scrubbers. They all have mandatory 24/7 air quality monitoring.
Read the FoS "Burning Questions" review HERE on the FoS website.
CliSci # 190 2015-01-10
The Sun, Ozone and the climate
Jo Nova asks whether variations in the solar radiation spectrum are driving ozone formation and resurrects a 2010 hypothesis by Stephen Wilde that states: "The Sun affects the ozone layer through changes in UV or charged particles. When the Sun is more active there is more ozone above the equator and less over the poles, and vice versa. An increase in ozone warms the stratosphere or mesosphere, which pushes the tropopause lower. There is thus a solar induced see-saw effect on the height of the tropopause, which causes the climate zones to shift towards then away from the equator, moving the jet streams and changing them from zonal jet streams to meridional ones. When meridional, the jet streams wander in loops further north and south, resulting in longer lines of air mass mixing at climate zone boundaries, which creates more clouds. Clouds reflect sunlight back out to space, determining how much the climate system is heated by the near-constant incoming solar radiation. Thus the Sun 's UV and charged particles modulate the solar heating of the Earth."
In WUWT, Paul Homewood muses that a reduction of pollution in late 20th century Europe has resulted in an increase of sunshine hours accounting for higher temperatures of the eighties.
Vostok temperatures and the CO2/CH4 lag
The Vostok Antarctic ice core continues to keep researchers busy. While it has long been a favourite example of the 800 year gap between rising temperatures and trailing CO2 at the end of the last Glacial period, as shown on this blow up of Petit's graph, a posting by Euan Mearns in WUWT deals with the onset of that Glaciation.
He shows how in the cooling period the time lag is ten times as large as during the warming period and that CO2 and CH4 aren't then as well aligned with each other as during the warming. Petit et al (Nature 399, 1999), while noticing the 8,000 year lag, gave no interpretation.
Geologist/chemist Mearns investigated the difference in behaviour from a geochemical point of view and gives an interesting explanation.
The Sun and Earth temperature, bits and pieces
A study by Than Le: Solar Forcing of Earth ' surface temperature in PMIP3 simulations of the last millenium, (Atmospheric Science Letters) finds a quantitative linkage between Total Solar Irradiance (TSI) and Earth's near-surface air temperature (TAS) of past 1000-year as simulated by Paleoclimate Modeling Intercomparison Project 3 (PMIP3) models. The results demonstrate that there is causal feedback of TAS from TSI variations, especially in the tropical and subtropical regions. The consistency between models in simulating solar signal in TAS responses is significant in these regions with more than 70% selected models showing agreement.
There is no agreement between models in simulating TSI-TAS relationship in mid and high latitude regions.
But separately, Ogurtsov in Evidence for the Gleissberg solar cycle in NH high latitude (Advances in Space Research) fills the gap in the higher latitudes by finding a Gleissberg scale cyclicity in summer temperature reconstructions from the Taymir peninsula over four centuries.
"This periodicity is significant and consists of two oscillation modes, 60 70 year and 120 140 year variations. In the summer temperatures from the Yamal peninsula ( ˆ¼70 ° N, ˆ¼67 ° E) only a shorter-term (60 70 year) variation is present. A comparison of the secular variation in the Northern Hemisphere temperature proxies with the corresponding variations in sunspot numbers and the fluxes of cosmogenic 10Be in Greenland ice shows that a probable cause of this variability is the modulation of temperature by the century-scale solar cycle of Gleissberg. This is consistent with the results obtained previously for Northern Fennoscandia (67 ° 70 ° N, 19 ° 33 ° E). Thus, evidence for a connection between century-long variations in solar activity and climate was obtained for the entire boreal zone of the Northern Hemisphere."
The Sun: our pacemaker?
Just as the Sun and the planets provide the varying energies according to their own freedoms of radiation and movements so do the oceans and the atmosphere provide the intermediaries and the effect on our climate.
Two papers in Physics Letters A, by Douglas and Knox endow the oceans ' short cycles with the role of "climate pacemaker", both with the title of "the Sun is the Climate Pacemaker" part I: Equatorial Pacific and part II: Global Ocean (in press, free access, from Elsevier yet!)
In part I, equatorial Pacific Ocean temperature index SST3.4 was found to have segments during 1990 2014 showing a phase-locked annual signal and phase-locked signals of 2- or 3-year periods. Phase locking is to an inferred solar forcing of 1.0 cycle/yr.
Part II extends to the Global Ocean, from surface to 700 and 2000 m. The same phase-locking phenomena are found. The El Ni ±o/La Ni ±a effect diffuses into the world oceans with a delay of about two months.
How the solar system 's forces are transmitted to our climate - as we can observe they are - is a key piece in the puzzle and it will see more discussion than the present papers are getting in WUWT.
It also reminds us how little we actually still know abut the sun itself.
~~~~~~~~~~~~~~~~~~~~~~~~~~~~~~~~~~~~~~~~
©2002-2026 Friends of Science Society

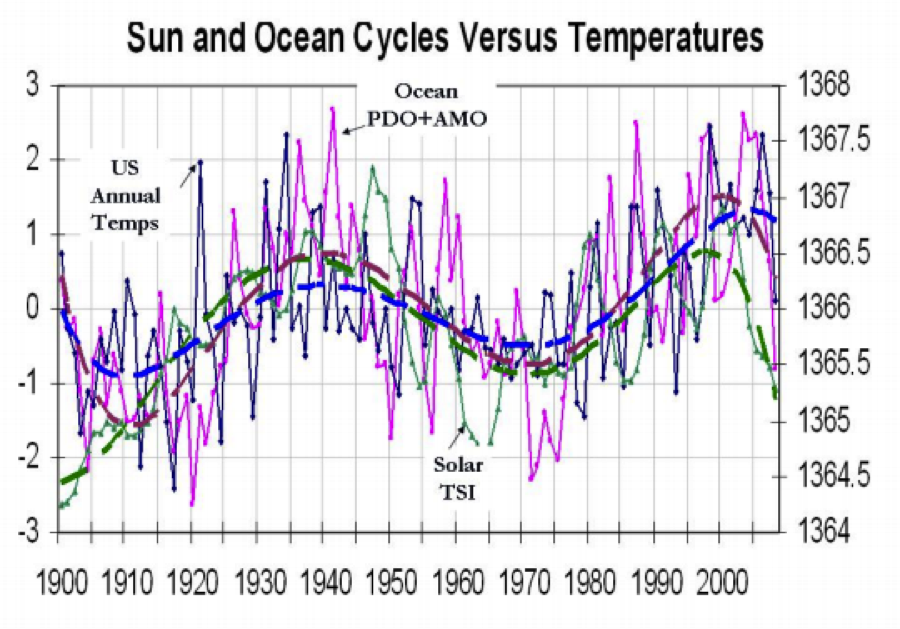