
By: Ken Gregory
CliSci # 274 2017-12-15
Shoreline Change in Atoll Reef Islands
This study gives irrefutable evidence on the persistence of atoll reef islands in French Polynesia over the last five decades, as 92% of the 111 islands studied exhibited either areal stability or expansion since the 1960s. Only 8% of the 111 islands showed contraction in area. Tropical cyclone waves contributed to island upward growth, which reached up to 1 m in places, through the transfer of sediments up onto the island surface.
The 1970s Global Cooling Scare
Forty-five years ago, December 3, 1972, two geologists wrote a letter to the president of the United States, Richard Nixon, warning that the descent into the next ice age might have already begun. An article on Enthusiasm, Scepticism and Science shows how the cooling scare set the stage for an easy transition to a warming scare. By 1961 there was general agreement that the warming trend in the Northern Hemisphere had ended about 1944. The world cooled to 1976 and then started to warm. New dating techniques of the Quaternary geology, the last 2.5 million years, showed that the most of the period was in an ice age interrupted by brief interglacials on a 100,000 year cycle. A National Climate Act was passed in 1978 in the USA which set up a National Climate Program Office and other bureaucratic infrastructure to study the cooling threat. A World Meteorological Organization (WMO) panel downplayed the concerns about cooling. In 1979, much concern was raised about the carbon dioxide (CO2) warming threat at a climate conference. The UN Environment Programme commissioned an international study in 1983 of the CO2 warming threat. In 1987 the USA called for an intergovernmental panel to assess the CO2 issue and the IPCC was born.
Medical Journal Perpetrates the Noble Lie that American Air Quality Kills
An article published by American Thinker accuses the New England Journal of Medicine (NEJM) of promoting the Noble Lie by publishing false claim about air quality lethality. The article says that air quality in America isn 't killing anyone. A study by Di et al, June 2017 titled Air Quality and Mortality in the Medicare Population claimed that air quality was killing thousands of elderly Americans every year, but it showed a very insignificant increase of 8% in elderly Americans deaths in the range of natural variance or noise . Two previous studies showed air quality wasn 't killing anybody and refuted the claims of the Di NEJM study. The lead authors of both of these studies wrote letters to the journal strongly objecting to the Di et al 2017 study. Steve Milloy wrote a protest demanding NEJM corrections, followed by a second letter by Dr. John Dunn. The Di article failed to cite any null studies, which Milloy claims is dishonest scientific misconduct.
Status of Canadian Polar Bear Subpopulations
Two papers reviewed here show that there is almost no connection between the long-term observations of polar bear ecology and claims the polar bears are in danger due to climate change. A study by York et al considered both observations from native populations and scientific information and showed that 12 subpopulations were stable or increasing and one declining. There is no trend evident from the summed subpopulation numbers from the PBSG status reports. On multiple occasion the traditional ecological knowledge from local Inuit populations accurately identified polar bear subpopulation trends before new scientific studies had been conducted. The polar bears survived the warmer Arctic temperatures of the Eemian interglacial, when temperatures were 4 °C warmer than current temperatures. A study by Wong et al 2017 reports that Inuits are having more bear encounters in recent years than in the past, and that they rarely see unhealthy bears.
Cooling Effect of Natural Atmospheric Particles Is Greater During Warmer Years
A global aerosol model was used to make an assessment of terrestrial natural aerosol climate feedbacks, constrained by observations of aerosol number. A study lead author Dr. Catherine Scott, from the School of Earth and Environment at Leeds, said: Natural particles can alter the climate, but they are also strongly controlled by it. The study found that warmer temperatures are associated with higher concentrations of large (>100 nm particles). These particles reflect sunlight causing a cooling effect. The particles come from forest fires and gases emitted by trees that form tiny particles in the atmosphere. This cooling offsets some of the temperature rise and is known as a negative climate feedback. Study co-author Dominick Spracklen said Our research highlights the need for these complex interactions to be well represented in climate models. The climate feedback due to fires and organic aerosols is estimated to be -0.17 W/m2/ °C.
Population Growth and the Food Supply
The IPCC 's Working Group II technical summary of the Fifth Assessment Report (AR5) says For the major crops (wheat, rice, and maize) in tropical and temperate regions, climate change without adaptation is projected to negatively impact aggregate production for local temperature increases of 2 °C or more above late-20th-century levels, although individual locations may benefit (medium confidence). This is not a forecast as developing countries are continually adopting farming technology of the developed world, and farmers adapt to temperature changes by utilizing the best farming techniques and crop strains for the local climate. Andy May writes on WUWT As recently as 1968, Paul Ehrlich published The Population Bomb which predicted, among other things, that hundreds of millions would starve to death in the 1970s . The population growth rate is currently only 1.12%, down from over 2% in the early 1960s. The world population growth is expected to be less than 0.1% by 2100. World agricultural production has more than tripled since 1916, and more than quadrupled in developing countries, as we produce 23% more food per person than in 1960.
Greenhouse Gas Emissions of Electric and Internal Combustion Engine Vehicles in China
A study compared the energy use and greenhouse gas emissions of electric vehicles and internal combustion engine vehicle (ICEV) production in China. The study found that the greenhouse gas emissions due to electric vehicle production in China are 15.1 metric tonnes of carbon dioxide equivalent (tCO2eq), which is 50% greater than the 10.0 tCO2eq of vehicles with internal combustion engines. The large difference is mainly due to the large amount of energy required to produce the batteries and the greater weight of electric vehicles (EV). Also, China 's electrical grid is powered 72% by fossil fuels. According to Barkenbus (2017), when EVs receive electricity with emission levels exceeding 559 gCO2/kWh, they, unfortunately, are net contributors to climate change when compared with conventional vehicles. China 's electric vehicles receive electricity from the grid with emission levels of 712 gCO2/kWh, which is 27% greater than the emissions associated with driving the average ICEV. So in China, both the production and driving of an EV cause substantially more CO2 emissions than that of an ICEV.
CliSci # 273 2017-12-02
A Veneer of Certainty Stoking Climate Alarm
In private, climate scientists are much less certain than they tell the public. This article by Rupert Darwall, explores the expressions of public certainty by climate scientists versus the private expressions of uncertainty, in context of a small Workshop on Climate organized by the American Physical Society (APS). It provides a cogent argument for a red/blue team assessment of climate change. The manufacture and enforcement of a consensus on human-caused climate change is a fundamentally anti-scientific process when debate, disagreement, and uncertainty are suppressed. Dr. Collins, an IPCC lead author says We understand a lot of the physics in its basic form. We don 't understand the emergent behavior that results from it. The discussion revealed that To match observations, some of the forcings in some of the models had to be scaled down. But when it came to making the centennial projections, the scaling factors were removed, probably resulting in a 25 to 30 percent over-projection of the 2100 warming, Koonin said. Yes, that means the models have low sensitivity to greenhouse gases during the history period, but high sensitivity in the forecast period. Excerpts of the essay are at this blog post by Judith Curry.
Does Low Sea-Ice Threaten Polar Bears?
Dr. Susan Crockford published a paper for feedback before peer review that challenges the hypothesis that low sea ice area of 3 to 5 million km2 results in more than 30% decline in the polar bear population, as predicted by the International Union for the Conservation of Nature. The polar bear is the first species to be classified as threatened based on predictions of future conditions rather than the current status. The period since 2007 has seen summer sea ice at the 3 to 5 Mkm2 level, but polar bear numbers have not declined and no subpopulations have extirpated. Several high risk subpopulations remain stable while five have increased in population. In 2005, the global polar bear population was estimated at 22,500. The population estimate increased to 26,500 in 2015. Data collected between 2013 and 1015 but release after the previous 2015 estimate was made suggest the 2015 population was about 28,500 polar bears, an increase of 6,000 polar bears in a decade of low sea ice area. The abstract concludes judgments to list polar bears as threatened based on future risks of habitat loss were scientifically unfounded .
Climate Sensitivity from the Bulk Atmosphere
A new study by John Christy and Richard McNider used the warming of the bulk troposphere from satellite data to calculate an upper limit on transient climate sensitivity. The study removed ocean effects like El Nino and effects of two major volcanoes to determine a temperature trend attributable to only greenhouse gasses and natural forcing. If natural forcing contributed nothing, which is extremely unlikely, the temperature trend is 0.096 °C per decade, giving a climate response of 1.1 °C to a doubling of CO2, which is about one-half of the value estimated from climate models. The 39-year satellite record shows no acceleration of warming despite increasing greenhouse gases in the atmosphere, contrary to climate model predictions. Dr. Christy said this indicates the real atmosphere is less sensitive to CO2 than what has been forecast by climate models. This suggests the climate models need to be retooled to better reflect conditions in the actual climate . The satellite record of the bulk atmosphere temperatures is superior to the records of surface stations temperatures as those measurements are contaminated by the effects of human economic development. The lack of warming found in the bulk atmosphere compared to model projections imply that the water vapor feedback in climate models is much too high and the climate is much less sensitive to greenhouse gas emissions than the models suggest. A link to the paper is at the end of this article.
How America Can Dominate the World Energy Market
Tom Harris, executive director of the International Climate Science Coalition, writes in the Washington Times about America First Energy Conference on Nov. 9, organized by the Heartland Institute, contrasting its message to that from the recent UN climate conference in Bonn. Craig Idso told the audience that the whole biosphere is reaping incredible benefits from increasing CO2. Energy dominance is achievable if current development plans continue. One speaker said America could become a net exporter of oil within five years. America has the world 's largest coal reserves, but exports are hampered due to lack of export terminals.
Does Air Pollution Really Shorten Life Spans?
There are numerous report in the media claiming that fine pollutants will shorten life spans or cause deaths. For example, The Economic Times (India) claimed With pollution levels in NCR [national capital region of Delhi] 40 times the World Health Organization 's safe limit, your life expectancy could be cut short . Dr. Indur Goklany compares real measurement of fine particle pollution, PM2.5, being particles less that 2.5 microns in diameter, to life expectancy, incomes and CO2 emission in the world 's most polluted cities. Delhi has the highest PM2.5 levels in India, but is also has the second highest life expectancy among India 's states at 73.2 years for 2010-2014. Beijing, China has high PM2.5 levels but has the 2nd highest life expectancy of 82 years, behind Shanghai of 83.2 years in 2016. The claims the high PM2.5 causes deaths are based on models calculating statistical deaths, which Indur calls fake deaths. He concludes In today 's world, claims of air pollution shortening life expectancy are fake news premised on fake deaths.
The JRA-55 Reanalysis for Global Temperatures; Cooler Than the Rest
Dr. Micheals and Dr. Maue of the Cato Institute wrote this article introducing the JRA-55 reanalysis for global surface temperatures. The data set is based on balloon radiosonde data that was used to initialized weather forecasts. The authors of the data say that it is more reliable than any other dataset. The reanalysis starts in 1955, and incorporates satellite data since 1979. Computers produce a three-dimensional map based on the balloon data that are internally consistent with the laws of physics and avoids the numerous problems with surface station measurements. The article presets a graph of global temperatures from 1979. The warming trend is 0.10 °C/decade until the 2016 El Nin o, or about 40% of that simulated by climate models. This is the most physically realistic measure of global average surface temperatures and is also the coolest. The article gives a good summary of the problems with surface station datasets.
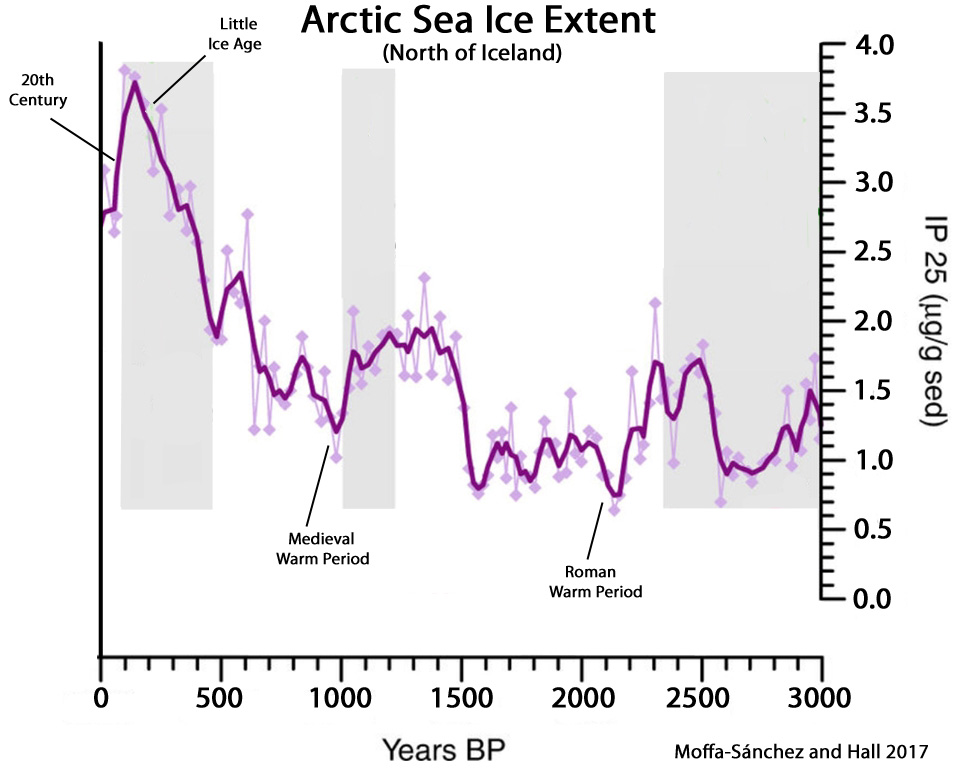
North Atlantic Variability and European Climate over 3000 Years
A paper published this month in Nature Communications shows that North Atlantic circulation changes and Arctic water flows modulated the European climate using new marine proxy reconstructions over the last 3000 years. The paper presented a sea ice reconstruction from a location North of Iceland. Kenneth Richard, who reviewed the paper wrote The authors find that while Arctic sea ice coverage was more advanced during the Little Ice Age, sea ice concentrations in the waters north of Iceland were far lower than now from about 500 years ago onward, especially during the centuries encompassing the Medieval Warm Period and Roman Warm Period.
CliSci # 272 2017-11-20
Reconciling Model-Observation Reconciliations
Steve McIntyre wrote an blog post about various comparisons of climate model temperature projections to the observations. John Christy has presented a graph that shows a large discrepancy in the tropical mid-troposphere and this graph of the global lower troposphere (not in the post). Zeke Hausfather has presented a graph that shows no significant discrepancy between models and observations of the 1979 to 2016 surface temperatures. Christy has said that surface temperature comparisons are an invalid test of the models because modelers adjust the models surface trends using aerosols to roughly match the observations. Cowtan and Way argued that much of the discrepancy at the surface was because the surface temperature indexes (HadCRUT4 and GISS) combines air temperature over land with sea surface temperatures. In the models, air temperatures over the oceans rise faster than the sea surface temperatures, but not in the measurements. The Hausfather graph combines air temperature over land with sea surface temperature in the models to compare with the HadCRUT observations. McIntyre says an equally logical approach would be to compare modeled air temperatures to observations of air temperatures over both land and oceans, and that graph shows a dramatic large discrepancy. [The ends of the boxes in the graph represent the 25th and 75th percentiles of the model runs.] McIntyre says the comparisons show that; according to models, tropospheric trends should be greater than surface trends. This is true over ocean, but not over land. According to models, marine air temperature trends should be greater than sea surface temperature trends, but the opposite is the case. See the post here.
Links Between Continental Rifting, CO2 Degassing and Climate Change
A paper published in Nature Geoscience estimates that tectonic CO2 release rates during the Mesozoic (160 to 100 million years ago) and Cenozoic (after 55 million years ago) reached more than three times the present values. The authors conducted a worldwide study of continental rift lengths over the last 200 million years. They conclude continental fragmentation and long-term climate change could plausibly be linked via massive CO2 degassing in rift systems.
Asian Glaciers Almost in Mass Balance
A study recently published in Nature Geoscience presented the mass balance of glaciers in Asia using satellite stereo-imagery for the period 2000 to 2016. The authors calculated a total mass change over the period of -16.3 ± 3.5 Gt/yr, equivalent to a sea level rise of 0.046 mm/yr, or less than 0.5 cm per century. These high mountain Asian (HMA) glaciers are the largest concentration of glaciers outside of the polar regions. Kenneth Richard writes Previous model-based estimates have generated HMA glacier melt and sea level equivalent values nearly 4 times greater (-46 Gt yr-1, +0.13 mm yr-1). Some glaciers are losing ice while some are gaining ice. Model-based estimates are far too large due to the lack of direct measurements. See here.
The Tolerance of Palau Corals to Ocean Acidification
A Paper by Barkley et al. (2017) reported results of laboratory and field transplant studies of corals near Palaw 's Rock Islands in the Western Pacific Ocean. The studies were done to understand the coral 's response to ocean neutralization, more commonly called acidification. The calcification rates of two reef-building corals do not change despite a pH range of 7.84 to 8.04. Coral samples were obtained from two reefs at different pH levels, and grew them at three different pH levels for eight weeks in controlled laboratory conditions. For the field experiment, corals were transplanted between the two reefs over 17 months. The laboratory results show there was no difference in calcification rates in the corals despite reef origin and a pH range of 7.98 to 7.60. The authors said the corals are tolerant to acidification levels far below those to which they are currently exposed." Coral transplanted between the reefs showed significant declines in calcification rates, but they recovered when they were returned to their original reefs, indicating that they adapted to local conditions of non-pH environmental factors such as nutrient flow. CO2 Science reviewed the paper and wrote And that is great news for those who are concerned about the potential negative effects of OA [ocean acidification].
New Antarctic Heat Map Reveals Sub-ice Hotspots
An international team of scientists has produced a high-resolution map of the so called geothermal heat flux ' at the base of the Antarctic Ice Sheet. The data comes from magnetic measurements taken from airplanes flying over the continent. Warmer rocks lose some of their magnetic properties, so the magnetic measurements can be converted to heat flux. The map shows that the heat flux is concentrated in the Antarctic Peninsula and two locations in the Western Ice Sheet. Glaciologist David Vaughan said how the ice sheet will respond to atmospheric and ocean warming is influenced by the pattern of geothermal heat, and that 's why this new map is so important. See here.
No Methane Bomb; Minimal Methane Emissions During the Younger Dryas Abrupt Warming
Climate alarmist like to scare us with the methane bomb; the idea that a warming Arctic will thaw the permafrost and release large quantities of methane gas, causing accelerated warming. However, a recent study published in Nature shows that the increase in methane from old methane sources, including permafrost, marine methane hydrates and methane under ice, during the rapid warming at the Younger Dryas-Preboreal event at 11,600 years ago was only 19% or less of the total increase. The scientists used the carbon 14 isotope fraction in methane from ice core measurements to determine the fraction of geologically old methane to total methane released. Most of the methane release during the warming event was from wetlands. The paper says the measurements suggest that large future atmospheric released of methane from old carbon sources are unlikely to occur. The IPCC extreme greenhouse gas scenario RCP8.5 assumes very large methane releases from permafrost and methane hydrates, which is very unlikely.
CliSci # 271 2017-11-07
The Carbon Budget Review of Miller et al 2017
Dr. Clive Best published a good review of the Miller et al 2017 paper that shows the carbon budget required to meet a 1.5 °C temperature rise from pre-industrial 1870 is revised upward by a factor of four. It was widely reported that the reason the carbon budget estimated in the IPCC 's fifth assessment report was wrong was because the climate models are running too hot. Dr. Best explains that the largest cause of the revised estimate is that the fraction of our emissions remaining in the atmosphere is not increasing, contrary to model predictions. Models are running much too hot compared to our carbon dioxide emissions, less so compared to CO2 concentrations. The difference is due to the biosphere greedily absorbing CO2 causing a dramatic greening of the planet. Clive writes We now need more emissions than predicted in AR5 to bring CO2 levels up to where model reach 1.5 °C levels. As a direct result of this, the remaining budget has risen from ~50 GtC [gigatonnes of carbon] to ~200 GtC, which is an increase of a factor 4! See here.
Advanced Weather Forecasting Models Confirm the Urban Heat Island Effect
Meteorologist Joe Bastardi presented a weather map in his daily update on the Weatherbell website clearly showing warmer temperatures in metropolitan areas than surrounding rural regions. Most of the surface temperature measurement stations are located in urban areas, especially at airports, and are significantly affected by the amount of nearby buildings, parking lots and roads and waste heat. Tall buildings cause turbulence that mixes warmer nighttime air aloft down to the weather stations. Joe Bastardi says the models are so good now that they are picking up the urban heat island effect . That is weather models, not climate models. Peter Gosselin writes Dallas, Houston, Atlanta, Orlando, Chicago, New York City among other places are all showing higher temperatures, around 2 °C warmer. Climate models attribute urban warming to greenhouse gas warming. See the map here.
415 Scientific Papers Published in 10 months of 2017 Support Climate Skeptics
Ken Richards reports that 415 papers were published during the first 10 months of 2017 that support the climate skeptics position on climate change. The papers cast doubt on the IPCC led consensus position that CO2 is the dominant control knob on climate and show that nature has had a significant or major affect on climate during the modern era. The warming, hurricane activity, floods and droughts during the modern era are neither unprecedented nor remarkable. The climate models are unreliable as they are based on temperature records contaminated by urban warming and attribute natural warming to greenhouse gas warming. See here.
What You Won 't Find in the New National Climate Assessment
Climatologist Dr. Pat Michaels wrote an essay showing relevant climate information that was not included in the recently published, overly-alarmist US National Climate Assessment report. He first presents the iconic graph from Dr. Christy that shows the average trend of temperature projections from climate models overstate the tropical mid-troposphere warming trend by a factor of about 2.6 compared to the observations. Only the Russian climate model is realistic with a climate sensitivity of 1.4 °C to double CO2, which is much lower than the average of all the models at 3.2 °C. Michaels presents a graph of weather balloon temperature trends versus altitude (by pressure level) that shows the predicted warming at 200 mbar (12 km altitude) is 4.2 times the measured warming rate. Michaels writes The vertical distribution of temperature in the tropics is central to the formation of precipitation. This is the reason the models get the precipitation forecast wrong. Much of our precipitation forms in the tropics, so getting that wrong also trashes the temperature forecasts. See here.
Aging US Wind Energy Fleet Driving Surge in Operating and Maintenance Spending
A study by HIS Markit estimates that the operating and maintenance (O&M) spending by the wind energy industry in North America will exceed $40 billion cumulatively from 2015 to 2025. The average age of wind turbines will rise to 5.5 years in 2015, to 7 years in 2020, and to 14 years in 2030. The median O&M cost for a project with a full warranty was over $48,000 per MW per year in 2016. The report says that one-quarter of all turbines ' gearboxes need replacement during the first decade of operations. This is bad news for electricity consumers. See here.
Failed Climate Predictions
Javier prepared this list of failed climate predictions which shows that predictions from IPCC affiliated officials and climate scientists can 't be trusted. He concludes that these people don 't have a clue about future climate and its consequences, and are inventing catastrophic predictions for their own interest. Some failed predictions are; the IPCC estimated warming from 1990 was estimated to be 0.30 °C/decade, the actual was about 0.15 °C/decade. The IPCC TAR predicted in 2001 that milder winters will decrease heavy snowfall, but there has been little change, with the 2012-2013 winter having the fourth largest snow cover on record. In 2007 the IPCC predicted agriculture yields in some countries would be reduced by up to 50% by 2020 due to drought, but six year later they said there is no evidence of increasing drought. A top NOAA scientist in 2010 predicted more intense hurricanes, but no increase in hurricane frequency or intensity has been detected. In 2005 an official of the United Nations Environment Program predicted 50 million climate refugees by 2010, but the actual number was zero. See here for many more.
South China Sea SST Changes Linked to Solar Irradiance
A paper published last month reports on the linkage between the sea surface temperature based on a gravity sediment core retrieved from the South China Sea, and total solar irradiance. The sea surface temperature varied by about 1 °C over the last 2000 years. The core recorded warm temperatures and cold temperatures during the commonly defines periods of the Medieval Warm Period and the Little Ice Age, respectively. The SST variations matches well with total solar irradiance changes, suggesting a strong impact of external natural forcing. See here.
CliSci # 270 2017-10-19
Antarctic Sea Ice Now Similar to 100 Years Ago
An article by Dr. Luning and Professor Vahrenholt highlights three papers that estimate the Antarctic sea ice extent prior to the start of satellite measurements, which began in 1979. A paper published in The Cryosphere says there has been a steady increase in sea ice extent around Antarctica during the last three decades. The climate models projected decline sea ice, contrary to the satellite measurements. The authors analysed records from ship logbooks of Antarctic expeditions. They report that during the period 1897 to 1917 the summer sea ice edge was 1.0 to 1.7 ° further north in the Weddell Sea than in recent years, but in all other sectors of Antarctica the sea ice was comparable to the present day . Another paper in Geophysical Research Letters used a sea ice proxy representing the Amundsen-Ross Sea estimate of the sea ice change. They report a 1 °N expansion in winter sea ice during the 20th century and a total expansion of 1.3 °N since 1702.
CLOUD Experiment Reduces Climate Sensitivity to CO2
Empirical evidence shows the climate sensitivity to greenhouse gases are below the lower limit of the IPCC 's likely range of 1.5 4.5 °C/doubling of CO2 based on climate model results. Why are climate models so wrong? A big reason is that modelers thought that industrial age aerosols were causing substantial cooling that was offsetting a large part of the greenhouse gas warming. We now know that this assumption is incorrect. The CLOUD experiments at the nuclear facility CERN showed that the ionization of the atmosphere by cosmic rays account for nearly one-third of all particles formed. The experiments also shows the aerosol particle formed from biogenic nucleation from naturally produce organic vapour was the dominant source of particles in the pristine pre-industrial atmosphere , and that the amount of aerosol was much higher than previously assumed. That means that pre-industrial atmosphere was cloudier than previously assumed, and that greenhouse gases caused a much smaller portion of the warming since pre-industrial times. If modelers use the new aerosol data from CLOUD, they would have to substantially lower the climate sensitivity to our greenhouse gas emissions to roughly match the historical temperature record. Unfortunately, the chance that modelers will do that is between slim and none! See this report from the CERN Courier.
Solar Activity Plays Key Role In North American Blizzard Frequency
Linear regression and spectral analysis were used to detect any blizzard cycles or trends in the USA. From 1960-94, the US had an average of nine blizzards per year, but since 1995, the average has risen to 19 per year. Sunspot-minimum periods tend to coincide with more frequent polar outbreaks in the Northern Hemisphere that could increase the likelihood for blizzard occurrence. However, sunspot activity is only a small component in explaining the frequency of blizzard occurrence. Another reason for the dramatic rise could be from better reporting and monitoring of the storms. See a report by the MailOnline.
Global Warming by CO2 ECS = 0.7 °C
There had been several studies recently that use various techniques to estimate the equilibrium climate sensitivity (ECS) to CO2 with most of them concluding the ECS is near or less than 1 °C. Here I review a study by Hermann Harde published in the International Journal of Atmospheric Sciences. Harde performs detailed line-by-line radiation transfer calculations combined with a simple climate model to estimate the ECS. The radiation calculation were performed over 228 atmospheric layers and 3 climate regions. The climate model was calibrated to observations by the International Satellite Cloud Climatology Project. Harde finds that the direct CO2 effect without considering any feedbacks agrees well with the IPCC values. However, he finds that the water vapor feedback, including evaporation effects, and cloud feedbacks differ significantly from the IPCC values. Harde gives an excellent discussion of the reason why his feedback results are different from that estimated by the IPCC. The evaporation feedback dominates other feedbacks and is the most stabilizing effect with a damping factor of 0.56. The observed cloud changes cannot be explained by only temperature changes, but must also include solar forcing. Harde 's simulations predict a solar contribution of about 60% and a CO2 induced contribution of 40% to global warming over the last century. The solar effect is estimated at 1.7 °C per 1% change in total solar irradiance. The resulting equilibrium climate sensitivity is 0.7 °C, which is only 23% of the central estimate by the IPCC. Our September 2017 newsletter reported that the FUND integrated assessment model calculates a social cost of CO2 emitted in 2020 at -22 US$/tonneCO2, assuming a 3% discount. The negative value means that CO2 emissions are net beneficial.
The Diurnal Contrast in Local Climate Trend Induced by Desert Urbanization
The government temperature indexes are badly contaminated by the effects of urban development, which is called the urban heat island effect (UHIE). A new study looks at the UHIE at five cities in the desert environment. The study used Landset data for 1985 and 2010 to constrain the surface boundary conditions. The study shows that rapid urbanization caused nighttime warming and weaker daytime cooling, confined to the urban area and is not sensitive to the size of the city.
A Post-mortem of the World 's First Offshore Wind Farm
The world 's first offshore wind farm is being decommissioned after 25 years in Danish waters. It consisted of 11 turbines, each with a capacity of 0.45 MW, giving a total capacity of 5 MW. M.J. Kelly writes During its lifetime, it delivered 243 GWh to the Danish electricity grid. This equates to a load factor of 22% of its rated capacity. The actual energy output was 55% of the initial expected energy output. At today 's prices the project 's construction cost was £10 million and it generated approximately ‚ 12 million in revenue, so it spent 75% of its life paying off the construction costs, excluding interest. Including maintenance costs, Kelly estimates the project had a return on input cost of close to 1:1. By comparison, a typical fossil-fuel plant earns a return on input costs of about 15:1, including fuel costs.
CliSci # 269 2017-10-05
Arctic Ice Natural Variability
An blog article by Javier presents a fascinating analysis of Arctic sea ice extent. The minimum annual sea ice extent over the last 10 years shows an insignificant upward trend, despite repeated predictions of declining sea ice. Javier plotted a graph of Arctic sea ice melt - refreeze cycle, where the melt is the September value (year x) minus the previous March value (year x), and the refreeze is the March of the next year (x+1) minus the September value (year x). The graph shows that the winter sea ice growth is >80% predictable from the ice extent loss in the previous melt season. Javier says this indicates a very strong negative feedback in action where a large melting is followed by a large refreezing. Javier presents a simple model from three natural cycle and an anthropogenic component. He writes I do believe we are entering a period of Arctic sea ice stabilization, and even expansion, that should last until around 2042, and this is a prediction in stark contrast with IPCC 's ice models that see an end to summer Arctic sea ice by 2040-2080 for most scenarios . See here.
Wind Energy Expansion: Endangering Wildlife
World energy demand has been growing at about 2%/year. If wind turbines were to supply all of that growth, but no more, over the next fifty years we would require 350,000 two-megawatt wind turbines per year, increasing by 2%/year. At a density of 50 acres/MW, that would require an area of 1.3 times that of the USA (including Alaska and Hawaii). This wouldn 't replace any existing fossil fuel usage. Kenneth Richards writes The last remaining vulture species native to southeastern Europe is likely faced with extinction in the next few decades due to an eight to ten times greater mortality rate associated with the rapid expansion of wind energy projects in the region. Bats play an important role in plant pollination, seed dispersal and pest control but their populations have declined due to collisions with wind turbines. Richards reports that Roughly 25% of North American bats are now classified at risk for extinction, in large part due to wind turbines. the hoary bat population is projected to be reduced by 90% within the next 50 years. Up to 888,000 bats were killed in the United States in 2012.
A study found that a wolf species has had its reproduction rates reduced by the addition of nearly 1000 wind turbines in their habitat range. Wind energy provided 0.46% of global energy consumption in 2014. The ecological and wildlife cost of wind turbines needs to be added to the human heath cost and costs imposed on electrical systems due to the extreme variability of wind power. The costs of wind power very likely exceeds the benefits. See here.
Solar and Ocean Cycles Modulate Rainfall Trends
Rainfall changes are a major component of climate change. Several recent papers have studied rainfall and found that it is modulated by solar and oceanic cycles. A July-June precipitation reconstruction for the period AD 1777 2012 was developed from multi-century tree-ring records of Scots pine in Siberia, Russia. There was no significant difference in the number dry and wet periods during the 236 years of the reconstructed precipitation. Contrary to climate models, there was no increase during the late 20th and 21st centuries. Another study found that the 20th century precipitation variability in southern Tibet falls within the range of natural variability in the last 4100 years, and does not show a clear trend of increasing precipitation as projected by models.
A study of hydrologic units in the contiguous USA found that drought frequency appears to have decreased during the 1901 through 2014 period. A study of Mesoamerican [southern Mexico and Central America] monsoon variability over the last two millennia is based on a new high resolution hydroclimate reconstruction from two stalagmites from southwestern Mexico. The study found that monsoon strengthening coincided with La Ni ±a and a negative North Atlantic Oscillation. It also found that the Mesoamerican monsoon variability over the modern era is within the natural bounds of rainfall variations over the past 2250 years, which is contrary to climate model output.
A study by Lei et al 2017 presents an analysis of four peat cores from southeastern China which shows the precipitation history over the last thousand years. The results show that precipitation decreased since 800 yr BP [before present]. This decrease in precipitation was consistent with the decrease in temperature from the MWP [Medieval Warm Period] to the LIA [Little Ice Age], which implies that there was a wetter climate during the MWP and a less wet during the LIA in southeastern China. The wetter climate in this region was consistent with more frequent ENSO events, stronger East Asian Summer Monsoons and higher solar activity. Precipitation fluctuations on multi-decadal to centennial scales is consistent with the changes in solar activity, with dry intervals corresponding to periods of minimum solar activity. See an article by Ken Richard on these papers and others here.
CliSci # 268 2017-09-22
Ocean cycles, Not Humans, May Be Behind Most Observed Climate Change
Professor of atmospheric sciences Anastasios Tsonis wrote an essay describing the relationship between ENSO, other climate signals and global climate change. Tsonis is an expert on ocean oscillations. He shows how the El Ni ±o Southern Oscillation (ENSO), the North Atlantic Oscillation (NAO) and Pacific Decadal Oscillation (PDO) drive changes in the global climate on timescales of several decades. He says that computer simulations suggest that positive global temperature trends tend to trigger more El Ni ±o events while negative trends will trigger La Ni ±a events. But this in contradicted by the strong warming during 1910 to 1945 when there were more frequent La Ni ±a events. Instead, Tsonis finds that the climate signal ENSO, NAO and PDO often become synchronized. When the coupling between them begins to increase, at some coupling strength threshold synchronisation is destroyed and the system shifts to a new state. In all cases when a climate shift occurs, the NAO is necessarily coupled to the north Pacific. The results demonstrate that a dynamical mechanism is responsible for climate shifts and underscore the importance of natural variability in climate change. See here.
Major Study by Alarmists Confirms the Climate Models Were Wrong
A study published in Nature Geoscence confirms that the climate models are running too hot and that we can emit much more greenhouse gases than previously thought to still avoid a dangerous level of global warming. Myles Allen, a co-author of the study, said We haven 't seen that rapid acceleration in warming in the observations after 2000 that we see in the models. The abstract of the paper says We show that limiting cumulative post-2015 CO2 emissions to about 200 GtC [gigatonnes of carbon] would limit post-2015 warming to less than 0.6 °C in 66% of Earth system model members of the CMIP5 ensemble with no mitigation of other climate drivers, increasing to 240 GtC with ambitious non-CO2 mitigation. The previous estimate from the IPCC 's 2013 report shows that 70 GtC can be emitted after 2015 to keep temperature rises to just 1.5 °C above pre-industrial levels, or 0.6 °C above 2015 levels. Climate skeptics have been saying for years that the IPCC climate models have been running too hot , but this is the first time the scientist who produced the IPCC 's carbon budget have admitted that the forecast was wrong. See a report from the Independent, UK here, the Washington post here, from Breibart here.
Plants are Getting More Efficient Thanks to Rising Carbon Dioxide
Researchers at the University of California San Diego found that rising CO2 are altering the behavior of land plants in ways that influence how much biomass they produce relative to how much water they need for growth. As CO2 has risen the ratio of 13C to 12C (the main atomic forms of carbons) in atmospheric CO2 has decreased, largely because CO2 from the combustion of fossil fuels has a low 13C/C12 ratio. The study shows that a discrepancy between the measured 13C/C12 ratio and what was expected is explained by the changes in the leaf stomata, the microscopic holes in leaves that allow a leaf to take up CO2. With more CO2 in the atmosphere, a plant can afford to have smaller or fewer stomata, thus allowing more photosynthesis for the same amount of water. The measurements of long-term changes in the 13C/C12 ratio of atmospheric CO2 imply that plants have globally increased their water use efficiency at the leaf level in proportion to the rise in atmospheric CO2 over the past few decades. The biosphere has become less constrained by water stress globally. Plant biologists had hypothesized that plants will achieve an optimum response to rising CO2. The study 's lead author said Optimal or near optimal behavior has been found in smaller studies on individual plants, but this paper is the first to show that it may be evident at the scale of the entire planet. See here.
Why Hurricanes Can 't Be Blamed on Global Warming
Dr. Spencer has written a Kindle book Inevitable Disaster on why hurricanes can 't be blamed on global warming. He writes that two major hurricanes that struck the Massachusetts area were stronger than any in modern times. There is no upward trend of major hurricanes in Florida, despite Irma. Spencer reviews the science of why hurricanes are not limited by sea surface temperatures. The book is a good deal at only CDN$3.65 here. See Dr. Spencer 's blog post here.
Response of Tropical Cyclones to Global Warming
A new, timely paper investigates the response of tropical cyclones [TC] to warming using a 14-km mesh climate simulation. Climate models, by contrast, typically use 200 km resolution. The abstract says, The model projected that the global frequency of TCs is reduced by 22.7%, the ratio of intense TCs is increased by 6.6%, and the precipitation rate within 100 km of the TC center increased by 11.8% under warmer climate conditions. The author told me by email the temperature change used was 1.3 °C. The reduction of TC frequency is much greater than the increase in intensity, implying that the total hurricane energy will be less in a warmer world. See here.
Arctic Sea Ice Minimum Extent is the Eighth Lowest of the Satellite Record
On September 13, Arctic sea ice reached its seasonal minimum extent of 4.64 million square kilometers (km2), the eighth lowest in the 38-year satellite record. This was 1.25 million km2 and 0.50 million km2 above the 2012 and 2016 extents for the same day, respectively. The 11-yr trend of annual minimum sea ice extent (2007 2017) is an insignificant +0.01 million km2/decade. See here.
CliSci # 267 2017-09-09
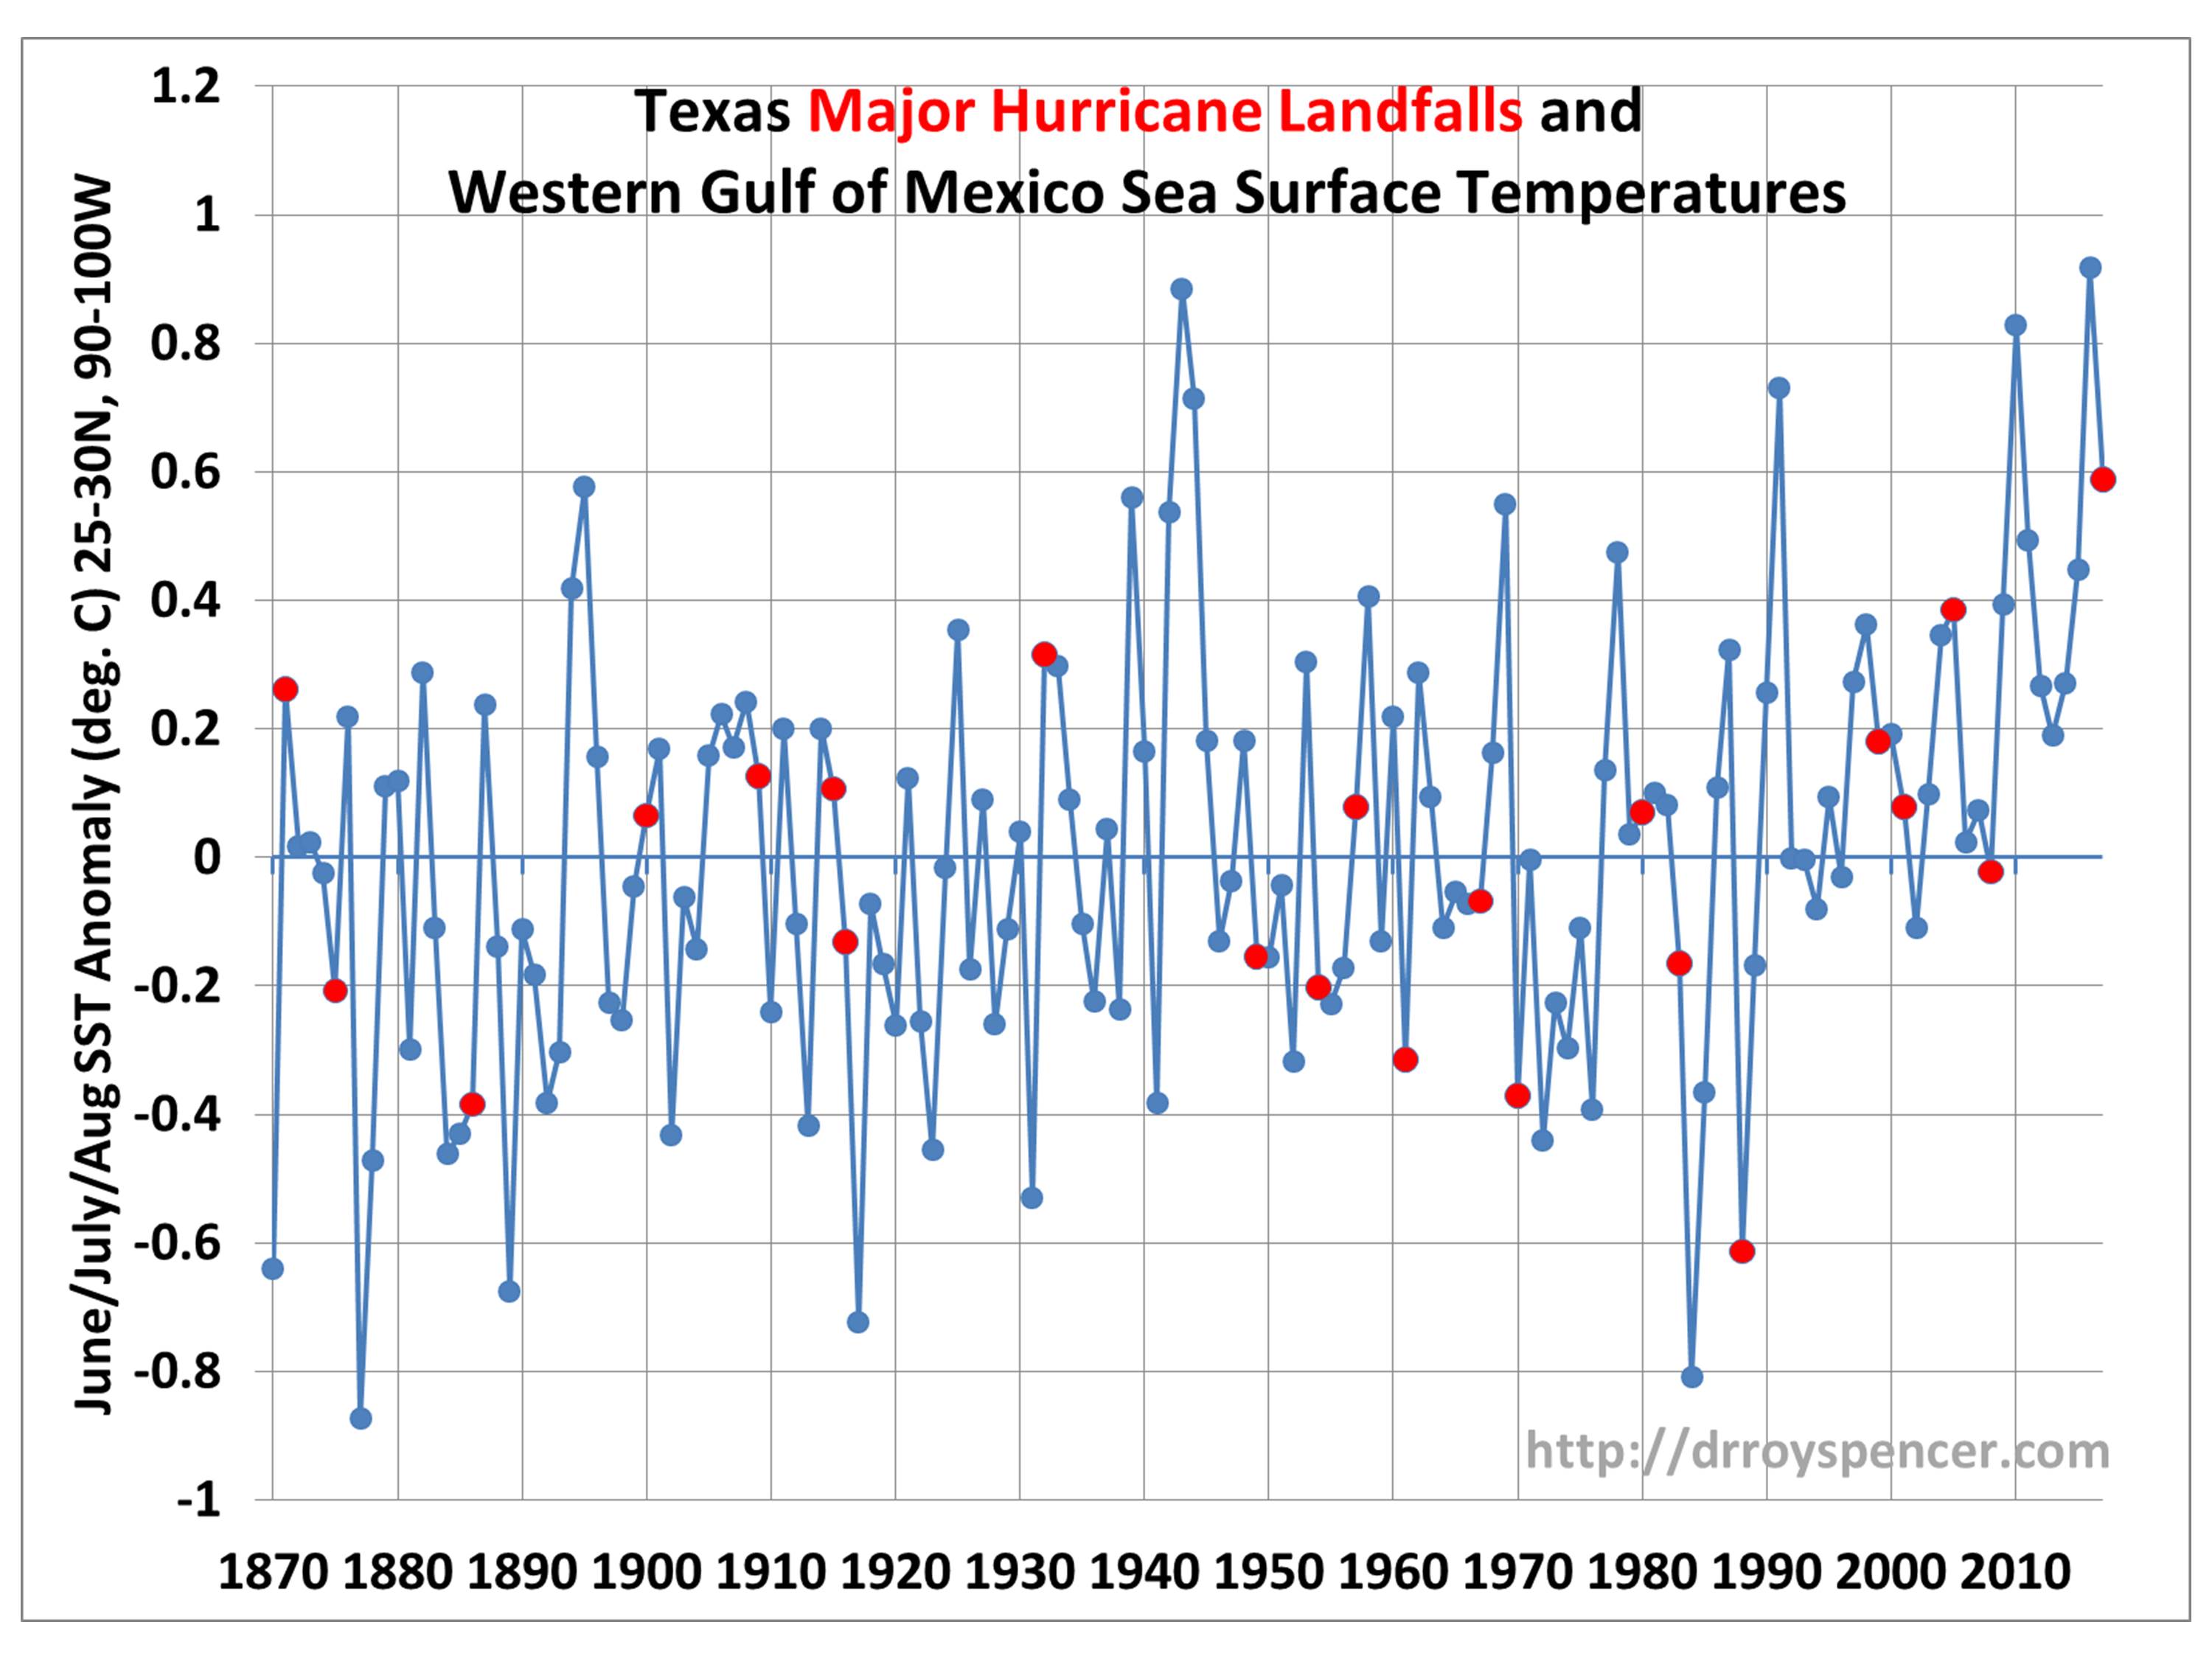
Texas Major Hurricane Intensity Not Related to Gulf Water Temperatures
There has been much speculation in the main stream media that the hurricane Harvey was made worse by global warming and high Gulf of Mexico sea surface temperatures. Dr. Spencer published a graph here showing the sea surface temperature of the western Gulf of Mexico of major hurricane strikes in Texas since 1870. The red dots on the graph represent the years of major hurricane strikes in Texas. The graph shows that major hurricanes are just as likely when sea temperatures are below average as when they are above average. I count 11 hurricanes with above average and 11 hurricanes with below average sea surface temperatures. Spencer writes, major hurricanes don 't really care whether the Gulf is above average or below average in temperature . See here.
Flooding Not Increasing In North America And Europe
A study by Hodgkins et al published in the Journal of Hydrology found that there is no evidence of increased flooding across North America and Europe. This supports the IPCC 's conclusion that there is no evidence of increased flooding on a global scale. The study assessed trends of major flood occurrences from 1961 to 2010 and from 1931 to 2010 using over 1200 gauges. Monthly trends were grouped by continent, climate region and catchment size. The number of significant major flood trends were about the number expected due to chance alone. There were more than three times as many significant relationships between major-flood occurrence and the Atlantic Multi-decadal Oscillation than significant long-term trends. There is no evidence that global warming leads to more flooding. See here.
Recent Temperatures in China Are Similar to Past Warm Period of the Last 2000 Years
A paper recently published by the Chinese Academy of Science presented a 2000-year temperature reconstruction in China with a 10-year resolution using a large number of temperature proxies. The researchers found four warm periods and four cold periods. The temperature amplitude between the warmest and coolest decades was 1.3 °C. The reconstruction shows that temperatures from 981 to 1100 and 1201 to 1270, the Medieval Warm Period, were as warm as the present warm period. The results confirm that the Medieval Warm Period was not just a European event, and that natural climate change can explain much if not all of the 20th century warming. See here.
Antarctic sea ice extent related to the Southern Annular Mode
A paper published in Geophysical Research Letters shows that the Antarctic sea ice extent is related to the Southern Annular Mode (SAM), also called the Antarctic Oscillation. The SAM is the slow north and south movement of a belt of westerly winds or low pressure area surrounding Antarctica. In its positive phase, the westerly wind belt contracts towards Antarctica. The paper shows that positive SAM anomalies in the austral summer are associated with anomalously cold SSTs that persist and lead to anomalous ice growth in the following autumn, while negative SAM anomalies precede warm SSTs and a reduction in sea ice extent during autumn. The analysis shows that the wind anomalies of the negative Sam during the 2016/17 summer contributed to the record minimum Antarctic sea ice extent in March 2017, rather than global warming. See the abstract here.
Can CO2 Also Explains Fair Weather?
Ron Clutz writes a post summarizing articles by Ross McKitrick in the Washington Examiner and by Gerry Bell in the New York Times, both concerning attributing global warming to hurricanes. McKitrick asks Why is global warming/climate change invoked only to explain bad weather (storms)? What about crediting CO2 for storms that didn 't happen? Some climate modelers predicted that hurricanes would be more frequent in a warmer world, while others predicted the opposite, and other said there was no connection between warming and hurricanes. After Katrina in 2005 there was a unprecedented 12-year absence of major hurricanes making landfall in the United States. Hurricane Harvey tied for 14th most intense hurricane since 1851. Hurricane expert Gerry Bell says that the formation of several hurricanes in rapid succession in not uncommon. The conditions in the tropical Atlantic off Africa are now ideal for hurricanes to form with a lack of abrupt wind shifts, or wind shear, that disrupt storm formation. Climate change is not considered when his group makes hurricane forecasts. They consider the naturally occurring climate pattern of the Atlantic Multidecadal Oscillation which has a strong effect on hurricane formation. See here.
Contribution of CO2 and Sun/Oceans to Global Warming
I published an empirical estimate of the transient climate response (TCR) to a CO2 doubling of 0.85 °C in my article Alberta 's Proposed Climate Plan here. This value was calculated based on the work of Lewis and Curry, but adjusted to include the millennium warming cycle and the urban warming. Ocean cycles are driven by solar heating so they are part of the solar effect. A stacked graph showing the component contributions to global warming from 1850 to 2016 is here. A comparison of the sun/ocean to CO2 contribution is shown here. The graph show the sun/ocean contribution has 3 cooling trends and 3 warming trends. The sum of the 3 cooling periods is 0.69 °C and the sum of the 3 warming periods is 0.94 °C, giving a total climate change of 1.62 °C. Meanwhile, CO2 caused a warming of 0.43 °C. (The breakpoints used were 1859, 1880, 1910, 1942 and 1973.) We can say that the sun has caused 3.8 times more climate change, warming and cooling, than the warming from CO2. From 1910 to 2016, the sun has cause 42% and CO2 has caused 30% of the global warming, see pie charts here.
CliSci # 266 2017-08-27
Re-calibration of Arctic Sea Ice Extent Datasets
A new dataset describing Arctic sea ice extent for 1901 2015 was constructed by re-calibrating sea ice data sources using the corresponding surface air temperature trends for the pre-satellite era (1901 1978), so that the strong relationship between seasonal sea ice extent and surface air temperature observed for the satellite era (1979-present) also applies to the pre-satellite era. The dataset shows that Arctic sea ice extent retreated after 1910, increased after the mid-1940s, and retreated since the 1970s. Arctic sea ice has alternated between periods of sea ice retreat and growth. The satellite record coincidentally began at the end of one of the sea ice growth periods. This has led to people mistakenly thinking the post-1978 sea ice retreat is unusual. The results from new sea ice proxies taken from ocean sediment cores suggest that Arctic sea ice extent was actually less before the Bronze Age than it is today. The current global climate models are unable to reproduce the observed Arctic sea ice changes since 1901, and they seem to drastically underestimate the natural sea ice variability. See the paper here and a discussion here. h/t Clive Schaupmeyer
An Inconvenient Deception: How Al Gore Distorts Climate Science and Energy Policy
Dr. Roy Spencer published a new e-book on Amazon.ca with the above title after viewing Al Gore 's new movie An Inconvenient Sequel: Truth to Power and reading the book version of the movie. He says The new movie and book are chock-full of bad science, bad policy, and factual errors. Spencer 's book reviews Al Gore 's history in the environmental movement then debunks the movie point by point. Spencer says One of Gore 's favorite tactics is to show something that happens naturally, then claim (or have you infer) that it is due to humanity 's greenhouse gas emissions. The Kindle version can be purchased here for CND$5.01. See the blog post about the book here.
Most of the Recent Warming Could be Natural
A paper titled The application of machine learning for evaluating anthropogenic versus natural climate change was published in GeoRes Journal this month. The authors deconstructed 2,000 years of proxy temperature data and input the results into an artificial neural network (ANN), which is a form of machine learning. The ANN was trained on the proxy temperature data up until 1830 and was used to forecast the natural climate cycles through the 20th century. Humans had almost no effect on climate before 1830. The projection from 1880 to 2000 shows that even if there had been no industrial revolution and CO2 emissions there would have been warming through the 20th century. The ANN projection shows a temperature increase of 2.5 °C from 1880 to 2000 in the northern hemisphere. The paper shows the temperatures from the proxy record in 1980 was the same as in the Medieval Warm Period at around 1150 in the northern hemisphere. The equilibrium climate sensitivity was calculated at 0.6 °C for a doubling of CO2. This value is 19% of the average value from climate models. See a blog post about the paper from co-author Jennifer Marohasy here and the paper, free of charge until September 30, here.
Competition Bureau Discontinued Inquiry into Friends of Science that Ecojustice Requested
Ecojustice Canada publicly issued a request for inquiry into Friends of Science Society via the Competition Bureau. Essentially, they objected to our billboards and website, claiming that our words were somehow blocking viable economic development of clean tech and that we were misleading the public. The Competition Bureau notified us recently that they have discontinued their inquiry. Ecojustice is telling people that the National Energy Board (NEB) should not be a pipeline assessment authority anymore. However, the NEB has done an excellent job for about 50 years. Ecojustice is misleading the public. See the video and transcript on WUWT here.
East Antarctic Ice Sheet to Remain Stable
A study by Indiana University shows that the East Antarctic ice sheet will remain stable even if the smaller west ice sheet melts. Recent studies show widespread water beneath the East Antarctic ice sheet which suggests it could melt from impinging ocean water. By drilling ice cores at the edge of the polar plateau, the team found evidence that the east ice sheet is stable despite much past climate change. The data supports ice sheet models that predict the east Antarctic ice sheet wouldn 't change very much even if the West Antarctic ice sheet was taken away. See here.
Climatic Variability in Northern China Over the Last 2200 Years
A recent study of the Northern China climate using high-resolution palaeoclimatic reconstructions presents the variations in precipitation and temperature from 200 BC to 2000 AD. The authors say the solar activity played a key role in driving the climatic fluctuation with climate cycles corresponding to solar cycles. Changes in precipitation may have been twice as important as temperatures changes in causing the recorded agricultural and geopolitical shifts in imperial China over the last 2200 years. See here.
CliSci # 265 2017-08-13
Health Effects of Global Warming
This article reviews three papers on the health effects of warming. A study published in 2015 examined 74 million deaths worldwide from 1985 to 2012 and found that the ratio of cold-related to heat-related deaths was a whopping 17 to 1. A study of heat-related deaths in the USA shows that as heat waves become more frequent, heat-related deaths decrease because of adaptation. There were 41 heat-related deaths/year/million population is the 1960s and 1970s dropping to 17 in the 1980s and to only 10 in the 1990s. A 2017 study of temperature-related hospital emergency visits in China over the period 2011 2014 shows that the risk is far greater for cold temperatures than for hot temperatures. When temperatures fall the risk of an emergency visit increased by 80% but when temperature rise the risk increases by only 15%. The length of hospital stays due to cold temperatures are ten times greater than that due to hot temperatures. See here.
Paleoclimate Cycles are Key Analogs for Present Day Warm Period
An article by Renee Hannon presents an excellent analysis of the climatic cycles over the last 450 million years using the Antarctica Dome C ice core data. The climate cycles are compared to the Milankovitch cycles which consist of eccentricity (elliptical orbit), obliquity (axial tilt), and precession (wobble) of Earth 's orbit. Hannon shows that the eccentricity and precession/summer insolation appear to correlate with the duration of the glacial cycles. Both the eccentricity cycle and the glacial cycles have become increasingly longer in duration over the past 450 kyrs. The start of an interglacial warm period occurs when eccentricity, obliquity and summer insolation are all increasing. Warm periods end due to decreasing obliquity. Hannon says climate models need to be changed to include astronomical forcings to reliably predict future climate changes. See here.
The Solar Variability Effect on Climate
Javier writes about how solar variability acts over the stratospheric pressure system transmitting the changes top-down, and over ocean temperatures bottom-up in this excellent article. Solar variability is highest at the short-wave part of the spectrum, where ultra-violet radiation can vary as much as 100% over an 11-yr solar cycle. Changing ultra-violet radiation has a strong effect on ozone in the stratosphere, which changes by about 3% over a solar cycle. Low solar activity appears to induce a contraction of the Hadley cells, and an expansion of the polar cells, steepening the Equator-to-Pole Temperature Tradient (EPTG). This increase of the EPTG causes an increasing amount of heat lost by the planet, thereby amplifying the direct cooling effect of lower solar irradiance. A persistent North Atlantic oscillation negative phase intensifies the effects over this particularly sensitive region. See here.
Recent findings from the CLOUD
The Cosmics Leaving OUtdoor Droplets (CLOUD) experiment was created to systematically test the link between galactic cosmic rays (GCRs) and climate. Several studies have shown correlations between GCRs and low-cloud cover on decadal and weekly time scales while other studies show a lack of correlation. An increase in GCRs modulated by solar activity cause an increase in small ions in the troposphere which increase the nucleation rate of 1 nanometer (nm) diameter aerosol particle, which may grow to diameters larger than 50 nm and act as cloud condensation nuclei (CCN), increasing cloud cover resulting in cooling. Recent CLOUD experiments at CERN show the GCR induced ions are responsible for around half of the nucleation. A paper published in the Journal of Geophysical Research shows that when the GCR intensity is changed by the amount over a solar cycle the change in CCN was only 0.2 0.3% at the altitude of low clouds. This is much too small of a CCN change to explain the observes 2% change in cloud cover. CCN respond too weakly to changes in GCRs to yield a significant influence on clouds and climate. However, other work suggests that cosmic rays could influence the freezing of liquid water in clouds or the amount of condensable material. See here.
Wetlands and Agriculture Responsible For Methane Increases, Not Oil and Gas
Methane levels in the atmosphere were stable from 1999 to 2007, but have increased since 2007 to 2015 by 53 part per billion. A NOAA news release says that the rare isotope carbon-13 associated with oil and gas production had dropped significantly ' over the same time frame. Instead, the chemical fingerprints point toward agricultural and wetland emissions from the tropics, The drop of carbon-13 rules out fossil fuels emissions, wildfires and biomass cook stoves as the reason for the post 2007 increase in methane. A methane expert at the University of London says that natural wetlands are responsible for most of the global methane growth since 2007, not agriculture. See here.
Statistical Link Between Solar Forcings and Ocean Variability
A study published in Climate Dynamics investigated the statistical link between solar forcing and ocean variability on various time scales. The authors found robust positive correlation between the Atlantic Multi-decadal oscillation (AMO) and solar activity, and negative correlation between the El Ni ±o Southern Oscillation (ENSO) and solar activity. See here.
CliSci # 264 2017-07-30
Sea Level Rise Is Not Accelerating
Willis Eschenbach calculated how well the tide gauge data fits a linear trend and a quadratic curve. He used 63 tide gauge records starting before 1950 and ending after 2015 which have more than 95% of the data. Using the R2 parameter to determine the goodness of fit, he found that in every record the accelerating fit was not statistically better than the linear fit. See his article here. I linearly infilled the missing data of the 63 tide gauge stations, removed the seasonal signal and created a graph of the 20-year and 30-year trends. The graph here shows the 20-year and 30-year trend at December 2015 was 1.50 mm/yr and 1.30 mm/yr, respectively. The maximum 30-year trend was 1.34 mm/y ending November 1983.
Electric Vehicles: Climate Saviors, or Not?
A paper published in Issues in Science and Technology shows that the widespread introduction of electric vehicles (EV), by itself, is insufficient to lead to reduced carbon emissions from the transport sector. The International Energy Agency (IEA) calculates that when EVs receive electricity with emission levels exceeding 559 gCO2/kWh, they are net contributors to carbon dioxide emissions when compared with conventional vehicles. However, many countries electrical generation exceed that emission level. China for example emits 712 gCO2/kWh of electricity generated, so an EV will result in increased emissions of 153 gCO2/kWh. An EV in Japan increases emissions by 13 gCO2/kWh. Most electrical grids are powered primarily by fossil fuels. See a summary here and the paper here.
Warming From Arctic Soot Underestimated
Dr. Sebastian L ¼ning and Prof. Fritz Vahrenholt reviews recent research of the warming effects of arctic soot, also known as black carbon aerosols. A paper found that soot deposited on glaciers in the European Alps caused them to retreat from their mid-19th century maximum. Without the soot, the glaciers should have continued to grow until about 1910. A paper last year found a small decrease in albedo in Greenland from 1981 to 2012. Another paper reports that climate models consistently underestimate the amount of soot in the Arctic compared to actual measurements during the spring and winter seasons. Climate models are falsely attributing Arctic warming caused by soot to greenhouse gas warming. Correcting the warming from soot in the models would result in lower climate sensitivity to greenhouse gases. See here.
Australian Temperature Record
A paper Parker and Ollier, 2017 reviewed the Australian temperature record and found that The global temperature trends provided by the Australian Bureau of Meteorology (BOM) are artificially exaggerated due to subjective and unidirectional adjustments of recorded values. and Over the full length of the long Australian records since the end of the 1800s, there is no sign of warming or increased occurrence of extreme events. The average of the 30 longest temperature records mean maximum temperature trend is 0.04 °C/century, which is negligible. The government reported trend from 1910 is 0.85 °C/century. The authors write, The climate trend maps compiled by Bureau of Meteorology in their climate change section are completely unreliable, as the alleged increasing temperature is obtained by lowering temperatures of the past by adjustments. Revising the raw temperature data of the past is an unscientific process that lies somewhere between dubious and fraudulent. See here.
Adjusting Measurements to Match the Models
Roger Andrews has published an analysis of adjustments to the raw temperature records. He used the raw data to reconstruct the GISS temperature index and found that the GISS index as published in 2000 for the southern hemisphere show about 0.3 °C more warming from 1900 than the raw temperature records. He then compares this old 2000 GISS series to the current GISS temperature series and shows that the current series added 0.2 °C warming in the northern hemisphere and 0.5 °C warming in the southern hemisphere. The BEST temperature record in South America before adjustments showed 58 station with a warming trend and 28 with a cooling trend. After the adjustments, all stations show a warming trend, and the average trend increased from 0.54 °C/century before adjustments to 1.09 °C/century after adjustments. See here.
Aerosol Forcing: Clouds Unfazed By Haze
Climate models use a large aerosol cooling effect during the tuning period to offset greenhouse gas forcing to roughly match the 20th century warming. CliSci # 262 here reported on a paper titled Strong constraints on aerosol cloud interactions from volcanic eruptions that shows clouds are well buffered against aerosol changes so aerosol forcing is substantially smaller than in most models. Climate models with excessive cooling response from aerosols and high climate sensitivity should be rejected. Models that are adjusted to match the lower aerosol effects must also have low climate sensitivity to match the 20th century temperature history. See a discussion by Frank Bosse here.
CliSci # 263 2017-07-17
Drivers of Recent Global Temperature Variability
A paper published in Climate Dynamics quantifies the recent drivers of global temperature variability using an information theory technique called Transfer Entropy . It allocates the temperature variability during 1984 to 2005 as measured by the Met Office/Hadley Centre HadCRUT4.5 amount CO2, CH4, N2O, aerosols, TSI, ultra-violet (UV) , cosmic rays (CR) and ENSO. Solar effects (TSI, UV and CR) are 17%, greenhouse gases (CO2, CH4 and N2O) are 48%, aerosols are 23% and ENSO is 12%. What is astonishing about this study is the climate change drivers that are ignored. During the period, the urban heat island effect caused 16% and the millennium warming cycle caused 3% of the warming. See the paper here.
Temperature Adjustments Account For Nearly All Of The Warming '
A new study found adjustments made to global surface temperature readings by scientists in recent years are totally inconsistent with published and credible U.S. and other temperature data. The study published at Tropical Hot Spot Research in June says the cyclical pattern in the earlier reported data has very nearly been adjusted ' out of temperature readings taken from weather stations, buoys, ships and other sources. Almost all the surface temperature warming adjustments cool past temperatures and warm more current records, increasing the warming trend. See the Daily Caller article here and the study here.
Greenland Ice Sheet
Summit Station (also known as Summit Camp) is a high-altitude (3,216 m) year-round research station in central Greenland. The typical July maximum temperatures at the summit are -10 °C, but the temperature plunged on July 4th to record a record low temperature of only -33 °C. The surface mass balance over the ice sheet has had record or near record levels of accumulated snow and ice since the fall of last year. It snows more than it melts, but calving of icebergs also adds to the total mass budget of the ice sheet. The calving loss is usually greater than the gain from surface mass balance, but monthly calving losses are unavailable. See a GWPF article here and the Greenland surface mass balance graph here.
Greenland Cooling Since 2005
Temperature monitoring stations at Greenland show the near-surface temperatures have been declining since 2005 according to a paper by Kobashi et al 2017. The ice cap summit temperatures have declined by over 2 °C from 2005 to 2015. The paper also shows that Greenland 's temperatures were 3 to 5 °C warmer 7,000 to 8,000 years ago based on ice core data. A paper by Mangerud and Svendsen, 2017 shows that August temperatures at the Svalbard islands east of Greenland were 6 °C warmer 10,000 to 9,000 years ago than today based on a temperature-sensitive shallow marine molluscs. The paper by Lansher et al 2017 used multi-proxy lake records of northwest Greenland to show that summer temperatures were 2.5 to 4 °C warmer from 4000 to 8000 years ago than now. See here. The average of the RSS and UAH satellite analysis of the lower troposphere gives a temperature decline since 2005 of 0.13 °C/decade in the Greenland region. The Greenland temperatures are important as Greenland glacier melting contributes to sea level rise.
Storm Frequency in China has Declined 50% Since 1960
The frequency of hail storms, thunderstorms and high wind events has decreased by nearly 50% on average throughout China since 1960. The study published in Scientific Reports also found that the strength of the East Asian Summer Monsoon decreased during the period. The team analysed the records of the Chinese National Meteorology Information Center, a network of 983 weather observatories, which they say is the most robust meteorological database known . One of the researchers said The frequency of thunderstorms and high winds decreased gradually over the time period we studied . See here.
Wind Energy 's 8 Serious Disadvantages; Hurts Wealth and Health
This article explains 8 serious problems or disadvantages of wind energy.
1. Unstable, erratic power supply
2. Wind turbines are expensive
3. Excess power is extremely difficult to store
4. Destruction of natural habitat
5. Bird kill: death from turbine blades
6. Danger from flying ice
7. Aesthetics and property values
8. Wind turbines produce noise and infrasound
See here.
New RSS Satellite Dataset Says the Models are Wrong
CliSci #262 here reported that Remote Sensing Systems increases its lower troposphere warming trend by 36%. Dr. Roy Spencer point out that the new version did not make a significant change in the tropics. The trend from 1979 to May 2017 changed by an insignificant 0.011 °C/decade to 0.134 °C/decade. By contrast, the trend of the climate models is 0.282 C/decade, or a factor of 2.1 too high. The models produce far too much warming in the tropics because they incorrectly assume too much positive feedback due to water vapour and cloud changes, so the models overestimate future warming. See here.
CliSci # 262 2017-07-04
Remote Sensing Systems increases warming by 36%
Remote Sensing Systems (RSS) published a new version of its lower troposphere product which increased the linear warming trend from 1979 to May 2017 by 36%. The trend increased from 0.136 °C/decade in version 3.3 to 0.184 °C/decade in version 4.0.The RSS trend from the year 2000 increased by 68%. A graph comparing the two versions is here. For comparison, the University of Alabama in Huntsville (UAH) trend is 0.124 °C/decade version 6.0 over the same period. A before-peer-review paper describing the new versions says it uses a new method to adjust for the effects of drifting local measurement time using information from the satellite measurements. See here. The trend difference between RSS v4 and UAH v6 from 1979 is an enormous 48!
Pronounced Differences Between Observed and CMIP5-simulated Multidecadal Climate Variability in the Twentieth Century
Sergey Kravtsov compared the climate model runs used in the last IPCC assessment report to temperature observations and found The observed internal variability so estimated exhibits a pronounced multidecadal mode with a distinctive spatiotemporal signature, which is altogether absent in model simulations. and the models underestimate the magnitude of the observed variability and misrepresent its spatial pattern. The author of this paper says that our ability to interpret and forecast climate using these models is limited . In plain language, the models are next to useless. See here.
Strong Constraints on Aerosol cloud Interactions from Volcanic Eruptions
Large volcanic eruptions represent natural experiments to test the effects of aerosols on clouds. This study published in Nature shows that the massive 2014 2015 fissure eruption in Holuhraun, Iceland, reduced the size of liquid cloud droplets consistent with expectations but had no discernible effect on other cloud properties. The amount of liquid water in the clouds were undetectable . This shows that most climate models have an excessive liquid water response to aerosols. There was a significant global cooling from 1944 to 1976. Climate modelers partially simulate the lack of warming by assuming a large increase in clouds due to increasing human-made aerosols over the period. The study implies that human-made aerosols was not the main cause, but rather natural climate change from natural ocean oscillations and lower solar activity caused the cooling. This might force modelers to include natural climate change in future climate models. See the abstract here.
Skillful Prediction of Northern Climate Provided by the Ocean
A paper published in Nature Communications showed that variations in ocean temperature in the high latitude North Atlantic and Nordic Seas are reflected in the climate of northwestern Europe and in winter Arctic sea ice extent. The authors show that a large part of the northern climate can be predicted up to a decade in advance by the state of the ocean currents. They predict that the Norwegian air temperature will decrease and the winter Arctic sea ice extent will increase towards 2020. See here.
NASA Detects a 24% Drop in Global Acreage Burned by Fire
An analysis of satellite data by NASA scientists and colleagues has determined that the global area of land burned each year declined by 24% between 1998 and 2015. The study found that savanna fires in Africa had declined by 700,000 km2, about the size of Texas. People of traditional cultures set fires to clear grazing lands of shrubs. As they build more permanent fields and villages the use of fire declines. Northern Australia also had a large decline in area burned by fire. The IPCC wrote in the AR5 2013 report Increases in the frequency or intensity of ecosystem disturbances such as droughts, windstorms, fires and pest outbreaks have been detected in many parts of the world and in some cases are attributed to climate change (medium confidence). The large drop in area burned by fire shows that the effect of climate change on fire is insignificant. See WUWT article here and Global Fire Emissions Database here.
THE BOTTOMLESS PIT: The Economics of Carbon Capture and Storage
Gordon Hughes, professor of economics at the University of Edinburgh, wrote a report on the economics of carbon capture and storage (CCS). This technology was intended to allow burning of fossil fuels without contributing greenhouse gases to the atmosphere by capturing and storing CO2 underground. The author finds the costs of carbon capture units have not decreased as much as was initially expected. The CCS was intended for base load coal-fired plants that operate 85-90% of the time, but these will operate a load factor of 55-65% in the future, which increases CCS costs by 40%, as the developing world invests in nuclear, intermittent renewable energy, and gas-fired plants. The cost of CCS will likely be US$160-200 per tCO2, which makes the technology prohibitively expensive. The upper limit that developing countries should pay for reducing CO2 emissions is only $50/tCO2. See here.
CliSci # 261 2017-06-22
Indirect Effects of the Sun on Earth 's Climate
Blogger Mike Jonas wrote an article that summarizes the two most important indirect effects of solar activity on climate and provides a way to look at them in the context of a coupled non-linear chaotic climate system. The first indirect solar effect discussed is the sun affecting the cosmic ray flux that enhances the growth of aerosols which seed cloud formation. The process chain of action has been demonstrated by laboratory experiments and observations from galactic cosmic rays to changes in clouds by Henrik Svensmark and the small team in Copenhagen. The second indirect solar effect is from changes in the ultra-violet (UV) portion of the solar spectrum that affects the amount of ozone in the stratosphere. The UV during the Maunder Minimum was about half of recent levels. An active sun causes more UV, more stratospheric ozone and warming which affects wind speeds resulting in large responses in the lower atmosphere. See here.
Climate Models Are Incorrectly Estimating Rainfall
Most global climate models are underestimating rainfall according to a new study. NASA and four universities compared climate data from 1995 to 2005 to 23 climate model simulations for the same period. More than 70 % of the climate models underestimated the amount of rain compared to real world observations. Warming leads to more rains in arid regions of the world. Extremely dry regions in Australia, California, Central Asia, Sinai and Southwestern Africa can all expect more rain. Previous research found that global warming has increased average annual rainfall by between 1 to 2 percent per decade since 1950, in wet and dry areas alike. Increasing rainfall would have beneficial environmental impacts for humanity. See here.
A Review of Skeptical Science ' Alleged Myths
Friends of Science was requested to produce a response to the Skeptical Science rebuttal of the 10 most used climate myths used by climate skeptics. The website Skeptical Science.com ' is popular among climate alarmists. It alleges to refute claims by climate skeptics that global warming is not a crisis. The website features a list of 10 alleged climate myths used by climate skeptics at the top left part of the webpage. I review and rebut each rebuttal of the 10 alleged myths. I find that;
1. Climate changes before CO2 changes
2. The Sun 's effects on temperature peaked about 2002
3. CO2 emissions leads to a better climate and a greening of the Earth
4. There is no consensus on the magnitude of greenhouse gas warming
5. The Earth was cooling for 18 years prior to 2016, disproving climate models
6. The vertical profile of warming disagrees with climate models
7. The surface temperature record is badly contaminated by urban effects
8. Plants and animals can adapt to the future climate changes
9. Ocean warming during the 18 yr hiatus points to low climate sensitivity
10. The Antarctic ice sheets are gaining about 82 billion tonnes/year of ice.
See my review and rebuttal of Skeptic Science here.
Renewable Energy Cost and Reliability Claims Exposed and Debunked
An article by Larry Hamlin summarizes a paper that exposes and debunks the contrived claims of a recent renewable energy study which falsely alleged that low cost and reliable 100% renewable energy electric grids are possible. Both papers were published by the Proceeding of the National Academy of Science. The new paper evaluated the study and found that it used invalid modeling tools, contained modeling errors, and made implausible and inadequately supported assumptions. The paper points out failure of the prior study to deal with critical electric system reliability requirements . Missing from the model are the ability to model frequency regulation, transmission requirements and operating reserves. The study ignores transmission capacity expansion, power flows, and the logistics of transmission constraints. The reliability needs of the grid must be provided by dispatchable electrical generation from fossil fuels and hydro power plants. Countries that have high installed solar and wind capacity have more than double the power cost of other countries, indicating that renewable energy is not cost effective. The paper 's abstract say Policy makers should treat with caution any visions of a rapid, reliable, and low-cost transition to entire energy systems that relies almost exclusively on wind, solar, and hydroelectric power. See Hamlin 's article here.
The Private Benefit of Carbon Dioxide
Dr. Richard Tol, co-developer of the FUND integrated assessment model, has calculated the average private benefit of carbon dioxide, which can be compared to FUND estimates of the social cost of carbon dioxide. The abstract of is paper says The private benefit of carbon is the value, at the margin, of the energy services provided by the use of fossil fuels. The private benefits is here estimated, for the first time, at US$411/tCO2. Tol writes, The focus on the damage done by emitting an additional tonne of carbon dioxide sometimes drowns out the gains from cheap and abundant energy and affordable and reliable energy is a great good. The private benefit of fossil fuels at the margin for residential electricity is US$1875/tCO2. By comparison, the social costs using the IPCC high climate sensitivity calculated by FUND in 2014 was US$6.6/tCO2. The social cost of carbon dioxide is negative (beneficial) when using lower, empirical-based estimates of climate sensitivity to CO2 emissions. See the paper here.
Northern Hemisphere Snow Cover
Was global warming supposed to reduce snow cover? See environment Canada 's northern hemisphere snow cover graph here. It shows that snow cover since April 20 has been more than one standard deviation above the 1998 to 2011 average observations.
Causality of the Drought in the Southwestern United States
A paper published in the Journal of Climate analyzed the driving forces of the now-ended drought in the southwestern United States. The paper shows that the Pacific Decadal Oscillation (PDO) and solar activity were the main drivers of the drought, with solar activity being the main driver over the past 120 years. The abstract says we find that both the droughts in the 1900s and in the 21st century were affected by the PDO and solar activity, whereas the droughts from the 1950s to the 1970s were mainly affected by solar activity. See here.
CliSci # 260 2017-06-08
Mitigating Urban Warming is Cost Effective
A study published in Nature Climate Change shows that policies to reduce the urban heat island effect (UHIE) are very cost effective. The study suggests that the social costs of increasing temperatures in cities could be twice that of rural area. During the period 1950 to 2011, 65% of urban areas warmed by 0.6 °C more than the world average, or at twice the world rate. Temperatures in cities warm faster than rural areas due to increases in heat absorbing surfaces including concrete and asphalt, tall building disrupting the boundary layer and increasing energy use in cities. Cities occupy about 1% of the earth 's surface area and consume 78% of global energy production. The researchers did cost benefit analysis of programs to reduce the UHIE. They found that changing 20% of a city 's roofs and half of its pavements to sunlight reflecting cool ' forms could save up to 12 times what they cost to install and maintain, and reduce air temperatures by about 0.8 °C. See here. Most weather stations are located in cities and the temperature indexes used to track warming are not corrected for the UHIE.
EPA is Told to Revoke the Scientifically Invalid CO2 Endangerment Finding
The Concerned Household Electricity Consumers Council announces that on May 8, 2017 it filed with the USA EPA a supplement to the Council 's January 20, 2017 petition asking the Agency to reconsider the scientifically invalid Endangerment Finding on which all Obama-era greenhouse gas regulations are based. The petition relies on research by Wallace 2017 et al that estimates the impacts of the key natural factors on temperatures. The research claims that CO2 does not have a statistically significant affect on temperatures. The council 's press release also says climate models show a pattern of warming in the tropical troposphere that simply does not exist in nature the Missing Tropical Hot Spot. Thus, the climate models have been invalidated and cannot be relied upon by EPA for attribution analysis in its Endangerment Finding. See the press release and commentary here.
Indirect Positive Effects of Ocean Acidification (Neutralization)
Most studies that report negative effects of decreasing pH level are based on simple laboratory experiments that may not apply to natural communities of sea organisms. A study by Connell et al evaluated the food and habitat relationship for a calcifying gastropod species living near CO2 vents in the southwest Pacific Ocean. The study found that the amount of algae increased nearer the CO2 vent which caused an increase in the abundance of the gastropod. The gastropods were thriving under lower pH conditions due to the increased food availability from algae. CO2 enrichment acts as a direct resource for photosynthetic organisms that are a food resource for calcifying species that completely overpowers any negative direct effects. See a review by CO2 Science here. The IPCC 's AR5 report shows the ocean pH has declined from 8.12 in 1980 to 8.08 in 2010. Numbers above 7.0 are alkaline and 7.0 is neutral. The ocean could never become acidic.
Early 20th Century Arctic Warming Caused by Ocean Oscillations
The northern hemisphere and the Arctic warmed rapidly from 1904 to 1944, followed by 30 years of cooling. A news release from Kyoto University says that scientists have discovered that the warming occurred when interdecadal warming phases of both the Pacific and Atlantic Oceans coincided. They report that early 20th century sea surface temperatures in the tropical Pacific and North Atlantic had warmed much more than previously thought . The team found that when the interdecadal ocean oscillations were included in simulation, the results properly reflect early Arctic conditions. See here.
Carbon Dioxide Emissions Rise in Germany, Fall is USA as Merkel Criticizes Trump
German Chancellor Angela Merkel criticized President Trump 's decision to withdraw from the Paris climate agreement. Merkel said she regrets Trump 's decision and will continue to work to save our Earth. But data from Germany 's Federal Ministry of Environment shows that Germany hasn 't reduced its CO2 emissions in 7 years and emitted more CO2 in 2016 than in 2009. Germany is failing horribly to reach its emissions targets. Germany 's CO2 emissions increased in 2016 over 2015 due to higher heating requirements due to a cold winter and increases in emissions from transportation. Meanwhile, CO2 emissions from energy consumption in the USA declined from 6000 million metric tons (MMT) in 2005 to 5150 MMT in 2016, a decline of 14%. The decline is mainly due to hydraulic fracturing and horizontal drilling in gas reservoirs which caused natural gas to replace coal in power generation. The USA 's emission decline of 850 MMTCO2 since 2005 is almost as large Germany 's total 2016 emissions of 906 MMTCO2. See here and here.
The Correlation of Seismic Activity and Recent Global Warming
Increasing seismic activity in the high geothermal flux areas of the oceans may play an important role in Arctic and global warming over the last sixty years. An article by Viterito 2017 demonstrates that increasing seismic activity in the globe 's high geothermal flux areas (HGFA) is strongly correlated with global temperatures (r=0.814) from 1979-2016. Increasing seismic activity at the mid-ocean 's spreading zones serves as a proxy indicator of higher geothermal flux in these regions. The additional mid-ocean heating causes an acceleration of the ocean overturning circulation which transports more heat into the Arctic. This is an update of a paper published in 2016 in the Journal of Earth Science & Climatic Change that gave a lower correlation (r=0.785) using data to 2015. The article claims the HGFA heat flux and seismicity accounts for about two-thirds of the variation in global temperatures since 1979. The paper also indicates that jumps in the seismic activity amplifies El Nino events, which occurred at the large 1998 and 2016 El Nino events. See the article here and the 2016 paper here.
CliSci # 259 2017-05-25
Extreme Weather Mortality Events Were Worse in the Past
The World Meteorlogical Organization has published a webpage showing Global Weather & Climate Extremes, including mortality of some weather events. Some events listed are;
Calgary Temperature Change
A document Calgary's Climate Program included this statement Over the past century, Calgary's average temperature has increased by 1.4 °C, with most of that increase occurring since 1970. , here. A graph I prepared of the Calgary international Airport temperature history here shows that the mean temperatures trend from 1900 to 2016 is 0.076 °C/decade, or 0.88 °C over 116 years. The mean maximum temperature trend is an insignificant 0.021 °C/decade. (The mean maximum temperature in a year is the average of the 12 monthly mean maximum daily temperatures.) The mean trend over the last 100 years is 0.088 °C/decade, giving a rise of 0.88 °C, much less than the 1.4 °C reported in the City of Calgary document. The mean maximum 100-year trend (1917-2016) is only 0.018 °C/decade. The mean maximum July and August temperatures have generally been falling. The July 1900-2016 mean maximum trend is -0.108 °C/decade as shown here. The July mean max 100-year trend is -0.226 °C/decade, so July maximum temperature are now more than 2 °C cooler than 100 years ago. Almost all of the mean temperature rise is due to rising minimum temperatures which are entirely beneficial and are mostly due to the urban warming effect. The airport and Calgary have grown greatly over the last 100 years.
Earth Is Becoming GREENER due to CO2 and Climate Change
The previous Clisci #258 here reported that a new analysis of forests found 467 million hectares of previously unreported forest, which increases estimated global forest area by 9%. Last year Zhu et al reported that over 25% to 50% of the global vegetated area is greening, with CO2 emissions causing 70% and climate change (warming) causing 8% of the greening trend. Dr. Pat Michaels writes virtually every place where there 's newly detected forest [it] is greening, and a large number of these are doing it in a statistically significant fashion. This leads to a remarkable hypothesis that one of the reasons the forested regions were undercounted in previous surveys (among other reasons) is that there wasn 't enough vegetation present to meet Bastin 's criterion for forest , which is greater than 10% tree cover, and carbon dioxide and global warming changed that. See here.
Climate and Epidemics in China
A paper by Lee et al. (2017) analyzed the relationship between climate and infectious disease epidemics in China over the period 1370-1909 AD. There were a total of 5961 epidemic incidents in China during the period. The level of precipitation was not significantly correlated with epidemic count. The scientist found that in China a standard deviation decrease in temperature (about 0.8 °C) caused an increase of 162 epidemic outbreaks. The abstract says cooling drove up epidemic outbreaks in northern and central China . This directly contradicts integrated assessment models that assume warming causes more disease and social cost. See the abstract here and a summary and graph here.
The Impacts of Urban Heat Islands in the Spanish Mediterranean
A paper published in the Journal of Mediterranean Meteorology and Climatology investigated the urban heat island effect (UHIE) in the Spanish Mediterranean. The study analyzed temperature series over the 1950 2013 period. The scientists found most of the temperature rise of urban stations occurred in the minimum temperatures, an indication of the UHIE. Satellite-based AVHRR infrared imagery was used to study the urbanization effects from 2001 to 2014, and urban temperatures were compared to rural temperatures . The abstract says The results obtained have shown both the nature of the [UHIE] phenomenon and its significant magnitude. This magnitude could account for between 70 and 80% of the recorded warming trend in Western Mediterranean cities. Therefore, failure to take this process into account might seriously bias any analysis of regional thermal evolution, the main aim of this study and an aim that equally affects the hypothesis of global climate change. The paper 's conclusion states, in these Western Mediterranean cities, the Urban Heat Island could account for up to 80% of the recorded warming." The abstract is here, the paper is here.
European Mean Sea Level Shows No Acceleration
European sea level records are among the best to detect an acceleration due to climate change. A paper Watson 2017 published in the Journal of Coastal Research used advanced techniques to analyze 83 long tide gauge station records across Europe. Most of the records are more than 100 years. The abstract states Key findings are that at the 95% confidence level, no consistent or compelling evidence (yet) exists that recent rates of rise are higher or abnormal in the context of the historical records available across Europe, nor is there any evidence that geocentric rates of rise are above the global average. It is likely a further 20 years of data will distinguish whether recent increases are evidence of the onset of climate change induced acceleration. In other word, the data shows no indication of an AGW induced sea level rise acceleration. See the open access paper here.
CliSci # 258 2017-05-13
Climate Dogma Exposed
Friends of Science hosted a successful dinner and speaker event at the Red & White Club in Calgary on May 9, attended by over 300 people. Robert Lyman spoke on Can Canada Survive Climate Change Policy?. Steve Goreham gave a slide presentation on Climate Science and the Myths of Renewable Energy . Our event page here includes links to Lyman 's speech and Goreham 's slide presentation. Steve Goreham also sold and autographed copies of his new book Outside the Green Box Rethinking Sustainable Development . You can order the book from his website here.
Antarctic Ice Sheet Mass Balance
A paper by Shepherd el al 2012 estimates the Antarctic ice sheet lost 71 ± 83 gigatonnes (Gt) per year from 1992 and 2011, which contributed 0.20 mm/yr to sea level rise. At that rate it would take 50 years for the Antarctic ice sheet to contribute 1 cm to sea level rise. The ice mass change in East Antarctica, West Antarctica and the Antarctic Peninsula was +14, -65 and -20 Gt/yr, respectively. However, a recent paper Martin-Espa ±ol et al 2017 estimates the East Antarctica total mass trend for 2003 to 2013 at +57 ± 20 Gt/yr, which is much higher mass gain than the +14 Gt/y of the earlier period. The authors used a combination of satellite altimetry, gravimetry, Global Position Satellite data with assumptions of geophysical processes. The paper shows there is great uncertainty of the allocation of the mass trends between the surface mass balance and ice dynamics. The results suggest that the total Antarctic ice sheet loss may have declined from 71 Gt/yr to 28 Gt/yr. See here.
Corals Are Adapting to a Warming Climate
A study published in the journal Marine Ecology Progress by the Wildlife Conservation Society reveals evidence that some corals are adapting to warming ocean waters. The study looked at responses to extreme temperature exposures in the same reefs over time, and found less coral bleaching in 11 of the 21 coral species studied. The study took place in two marine national parks of Kenya. Looking at two similarly severe warming events in 1998 and 2016, McClanahan found that the number of pale and bleached coral colonies declined from 73 to 27%, and 96 to 60% in the two parks with different background temperatures. Most of this change was due to about half of the most common species that did not bleach strongly in 2016. Bleaching takes place when stressed corals discharge beneficial algae that supply energy to corals causing them to turn pale or white and often starve. See the news release here.
A Paleo-perspective on Ocean Heat Content
A paper Rosenthal et al 2017 used proxy records from sediment cores and corals to create a 10,000 year record of ocean heat content [OHC]. The abstract states in part Here we review proxy records of intermediate water temperatures from sediment cores and corals in the equatorial Pacific and northeastern Atlantic Oceans, spanning 10,000 years beyond the instrumental record. These records suggests that intermediate waters were 1.5 2 °C warmer during the Holocene Thermal Maximum than in the last century. Intermediate water masses cooled by 0.9 °C from the Medieval Climate Anomaly to the Little Ice Age. These changes are significantly larger than the temperature anomalies documented in the instrumental record. The implied large perturbations in OHC and Earth's energy budget are at odds with very small radiative forcing anomalies throughout the Holocene and Common Era. We suggest that even very small radiative perturbations can change the latitudinal temperature gradient and strongly affect prevailing atmospheric wind systems and hence air-sea heat exchange. A graph of the reconstructed heat content is here. This study shows that small solar changes, which is the only source of radiative forcing during the period, cause large temperature changes. See here.
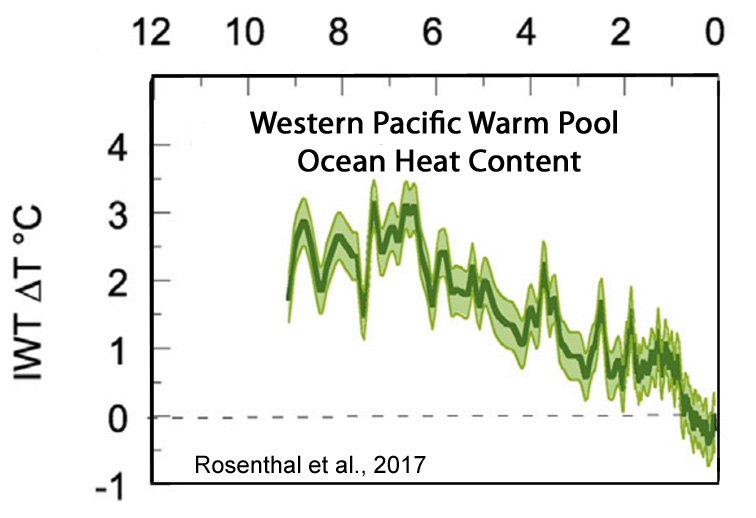
Are Methane Seeps in the Arctic Slowing Global Warming?
Biogeochemist John Pohlman of the U.S. Geological Survey and his team measured methane and carbon dioxide concentrations at the ocean surface above known methane seeps near Svalbard, about midway between continental Norway and the North Pole, during the Arctic summer. They found that the CO2 levels dropped whenever their ship crossed a methane seep. An article in Science says Pohlman and his team conclude that the same physical forces that are pushing the methane bubbles up are also pumping nutrient-rich cold waters from the sea bed to the surface, fertilizing phytoplankton blooms that soak up CO2 . The study found that 1900 times more CO2 is being absorbed than methane emitted, so that the cooling benefit of CO2 sequestration is 230 times greater than the warming effect from the methane emissions. See the Science article here.
Found: Lost ' Forests Covering an Area Two-thirds the Size of Australia
The Conversation of Australia reports that a new global analysis of the distribution of forests and woodlands has found 467 million hectares of previously unreported forest an area equivalent to 60% of the size of Australia. The discovery increases the known amount of global forest cover by around 9%, and will significantly boost estimates of how much carbon is stored in plants worldwide. Previous surveys were based on lower resolution satellite imagery without ground validation. This study used higher-resolution satellite imagery along with field information and validation. The survey found that drylands contain 45% more forest than has been previously reported. Dryland forests were previously difficult to identify globally due to the low density of trees. The study increases the estimates of global forest carbon stock by between 2% and 20%. See the article here, and the abstract of the journal article Bastin et al 2017 here.
Matt Ridley; Wind Turbines are Neither Clean nor Green
Matt Ridley writes a provocative article showing that wind energy will never provide a significant portion of the world 's energy needs. He asks: To the nearest whole number, what percentage of the world 's energy consumption was supplied by wind power in 2014, the last year for which there are reliable figures? Was it 20 per cent, 10 per cent or 5 per cent? None of the above: it was; See here.
CliSci # 257 2017-04-29
Last Chance to Purchase Tickets for The Friends of Science Society Annual Climate Science and Policy Event Climate Dogma Exposed
Ticket sales end on May 1st, 2017 for the event on May 9, 2017 at the Red and White Club, McMahon Stadium, Calgary. It features a buffet dinner starting at 6 pm and two guest speakers: Robert Lyman, Ottawa energy policy consultant, former public servant and author of numerous reports, speaking on Can Canada Survive Climate Change Policy? ; and Steve Goreham, author of The Mad, Mad World of Climatism and Outside the Green Box, speaking on Climate Science and the Myths of Renewable Energy . Buy your tickets onllne HERE, and click here for more information.
How Inconstant are Climate Feedbacks?
Nic Lewis published a rebuttal of a new paper by Kyle Armour which made two claims; 1, that long-term equilibrium climate sensitivity (ECS) from climate models are on average 26% about that inferred during transient warming over the historical period (ECSinfer), ie, that feedbacks increase over time, and 2, that climate sensitivity inferred during transient warming from climate models are consistent with energy budget observations. Armor estimated the modeled ECS by using simulations that abruptly quadrupled the CO2 concentrations, as the models take thousands of years to reach temperature equilibrium. Lewis finds that Armour over estimated the CO2 forcing by using a too short of an regression period. Lewis estimates that in climate models, the median ratio of ECS/ECSinfer is 1.16, which is under half of Armour 's value. However, Armour 's results are almost irrelevant to forecast temperature response at the end of this century because year 2100 warming will depend very largely on the level of the transient climate response , not on ECS. There is no observational evidence that climate sensitivity increases in the real climate system. The second claim is refuted by noting that the ECS from Lewis and Curry 2015 is 1.6 °C (or 1.45 °C using Stevens ' aerosol forcing) is much lower than the ECSinfer value of 3.0 °C from climate models. See Lewis ' post here.
Antarctic Ice Reveals Earth 's Accelerating Plant Growth
A paper by Campbell et al 2017 used data from an Antarctic ice core to show that the gross primary production of plants has increased by 31% ± 5% in the 20th century compared to pre-industrial times. The estimate was determined by measuring the decline in a rare molecule carbonyl sulfide '. Plants absorb and destroy it, reducing the level of carbonyl sulfide as plants grow. The paper 's abstract is here. The New York Times reported April 5, 2017 Analyzing the ice, Dr. Campbell and his colleagues have discovered that in the last century, plants have been growing at a rate far faster than at any other time in the last 54,000 years. The extra carbon stored in plants is 28 billion tons each year, or three times the carbon in crops harvested every year. See here. The greening of the earth can also be measured by satellites, but only since 1982, and it only gives a rough guide to plant growth as it measures leaf area only, not the growth of roots and tree trunks.
Delayed North Atlantic Response to Solar Forcing of the Stratospheric Polar Vortex
A study by Yukimoto et al., 2017 used a climate model to simulate the effects of the 11-year solar cycle on the strength of the winter stratospheric polar vortex. The solar cycle includes ~5% changes in the ultraviolet radiation which changes the stratospheric ozone and heats the air causing stratospheric circulation changes. This results in changes to the North Atlantic Oscillation (NAO), which is the dominant mode of atmospheric variability over the Atlantic. The NAO is the oscillation in sea-level pressures between the Iceland and Azores regions. Recent studies show the NAO is delayed about 3 years from the solar forcing via changes in the stratospheric zonal winds. This study shows the stratosphere signal penetrates into the troposphere during late winter to spring. The NAO response first occurs in January. The largest temperature anomalies of 0.9 °C and -1.1 °C occur between 40 °N and 45 °N at a lag of +3 and -3 years, respectively. The article concludes that the major solar influence on the Earth 's surface can be produced through changes in stratospheric circulation, and the spatial structure of the solar signal at the Earth 's surface is largely conditioned by atmosphere 's interaction with the ocean. See here.
Solar Influences on Climate Over the Atlantic / European Sector
A paper by Gray et al 2017 describes the observed 11-year solar cycle temperature signal at the Earth 's surface and the mechanism involving the ultraviolet radiation effects on stratospheric ozone. The Pacific ocean surface temperature shows both warming and cooling regions resembling the Pacific Decadal Oscillation. There is a significant correlation between the solar forcing and the sea-level pressure at 3 to 4 years lag after solar maximum in the North Atlantic. The large increase in ultra-violet radiation at solar maximum results in increased stratospheric ozone and heating, which causes increased westerlies in the subtropics. This results in a cooler, more stable polar vortex in solar maximum years. Winter zonal winds in the lower stratosphere influences the troposphere and the position of the Atlantic jetstream, thereby affecting the North Atlantic Oscillation (NAO), being the pressure difference between Iceland and the Azores. The sea surface temperature (SST) response to the NAO can explain the 3 to 4 year lag of the sea level pressure response over the Atlantic. The SST anomaly produced in the winter will persist below the mixed-layer during the following summer and re-emerge the next winter. During solar maximum the NAO can be enhance by additional forcing of a positive NAO via the ocean from the previous winter 's SST anomaly. This mechanism will cause significant solar-induced temperature variations in the North Atlantic and Europe. See here.
Robust Relationship Between Solar Wind Speed and North Atlantic Oscillation Discovered
An interdisciplinary team of researchers in China over the last 5 years examined the impacts of solar activity and earth motion factors on climate change. The solar flux is considered the fundamental energy source of earth 's climate system on long time scales. The team found a robust relationship between solar wind speed and the North Atlantic Oscillation in the winter on both a day-to-day scale and yearly variation, suggesting a much faster solar influence on climate than by ozone destruction by ultraviolet radiation. The scientists evaluated the effects of solar energetic particle flux on cloud charge, and they propose that the solar wind and electric-microphysical effect was the key mechanism of solar activity on climate. They demonstrated the marked impact of cloud droplet electricity on the collision efficiency of cloud condensation nuclei. This suggests that the collision in a cloud microphysics process constitutes the core link between atmospheric electricity and climate. The team constructed a physical model depicting the interdecadal response of the air-sea system to solar activity. The results are summarized here. The results were published in Atmospheric and Oceanic Science Letters here.
CliSci # 256 2017-04-09
Climate Dogma Exposed FoS Annual Event May 9, 2017
The Friends of Science Society annual climate science and policy event Climate Dogma Exposed will be on May 9, 2017 at the Red and White Club, McMahon Stadium, Calgary. It features a buffet dinner starting at 6 pm and two guest speakers: Robert Lyman, Ottawa energy policy consultant, former public servant and author of numerous reports, speaking on Can Canada Survive Climate Change Policy? ; and Steve Goreham, author of The Mad, Mad World of Climatism and Outside the Green Box, speaking on Climate Science and the Myths of Renewable Energy . Buy your tickets onllne HERE, and click here for more information.
Twelfth International Conference on Climate Change
The Heartland Institute held the 12th International conference on climate change in Washington, D.C. on March 23 & 24, 2017. See videos of the all of the presentations here. Some notable presentations are; Steve Goreham, who will a guest speaker at the FoS event on May 9, gave a presentation on sustainable development here. Dr. Ross McKitrick gives a presentation titled Uses and Abuses of the Social Cost of Carbon here. Dr. Willy Soon discusses the history of Arctic sea ice here. Dr. Craig Idso shows the monetary benefit of increasing CO2 on food production here. Dr. Pat Micheals discusses Vacating the Endangerment Finding which is required to repeal the US regulations against CO2 emissions, here.
Climate Scientists Tell Congress to Create a Climate Red Team
Prominent climate scientists have told a US congressional committee on March 29, 2017, that climate science as reported by UN and official government reports is dysfunctional, beset by bias and groupthink, and is using a profoundly unscientific approach. Dr. John Christy said: Congress needs a parallel, scientifically-based assessment of the state of climate science. Many important issues are left out of government-directed climate reports entirely; our policymakers need to see the entire range of findings regarding climate change . He argued that Congress should fund credible red teams ' that look at issues such as natural variability, the failure of climate models . See the written testimony of Dr. J. Curry, Dr. J. Christy, Dr. M. Mann and Dr. R. Pielke, Jr. here. A video of the hearing is here, starting at 16:20.
Freshening of the Labrador Sea as a Trigger for the Little Ice Age
A paper published this month in Climate of the Past uses high resolution record of ice rafting in the Labrador Sea to show that Arctic freshwater discharges to the Labrador Sea from melting glaciers reduces the amount of heat transported to high latitudes. The warmth during the Medieval Warm Period caused Greenland glacial melting that freshened the Labrador Sea and reduced the sub-polar ocean circulation, thereby reducing the ocean heat transport to the northern Atlantic. This would make the North Atlantic climate more unstable such that reduced solar irradiance and volcanoes could easily drive periods of severe cold conditions in Europe and the North Atlantic like the [Little Ice Age] LIA. This process drives long term climate cycles that are not included in climate models. Natural warming from the LIA are incorrectly attributed by the IPCC to greenhouse gas warming. See here.
Energy Return on Energy Invested (ERoEI) for Photovoltaic Solar Systems in Regions of Moderate Insolation
A paper by Ferroni Hapkirk analysed critically the photovoltaic (PV) solar power sources in regions of moderate insolation by using the concept of Energy Return on Energy Invested (ERoEI). The analysis used data from Switzerland and Germany. The ERoEI is the total energy output from a system divided by the total energy invested over the system lifetime. The paper reports PV technologies, consume per unit of electricity produced, 64 times more material resources, 7 times more human resources und 10 times more capital than nuclear technology. The analysis shows that the ERoEI is the energy return of 2203 kWh/m2 divided by the energy invested of 2664 kWh/m2, giving a ratio of 0.82. Due to the time value of money, a ERoEI of less than 5 is non-sustainable. The paper concludes today 's PV technologies cannot be termed an energy source, but rather a non-sustainable energy sink or a non-sustainable NET ENERGY LOSS. See the paper here.
Recent Increase in Oceanic Carbon Uptake Driven by Weaker Upper-Ocean Overturning
Recent data show that oceanic CO2 uptake rates have been growing over the past decade reversing a trend of stagnant or declining carbon uptake during the 1990s. This article shows that ocean circulation variability is the primary driver of these changes in oceanic CO2 uptake over the past several decades. The weakening upper-ocean overturning circulation during the 2000s decreased the outgassing of natural CO2, strengthening the CO2 sink and trapping natural CO2 in the deep ocean. See here.
Sun's impact on Climate Change Quantified
A study funded by the Swiss National Science Foundation quantified the effects of solar variability on climate change. The researchers calculated solar radiative forcing taking into account particles and electromagnetic radiation. The solar variations were set to match the natural climate changes over the last few millennia. The researchers estimated the contribution that the sun is expected to make to temperature change in the next 100 years. They expect the Earth's temperature to fall by half a degree Celsius within the next 50 to 100 years when solar activity reaches its next minimum. This would offset most of the expected warming from greenhouse gas emission to the end of the century. See the news release here.
CliSci # 255 2017-03-23
Climate Dogma Exposed FoS Annual Event May 9, 2017
The Friends of Science Society annual climate science and policy event Climate Dogma Exposed will be on May 9, 2017 at the Red and White Club, McMahon Stadium, Calgary. It features a buffet dinner starting at 6 pm and two guest speakers: Robert Lyman, Ottawa energy policy consultant, former public servant and author of numerous reports, speaking on Can Canada Survive Climate Change Policy? ; and Steve Goreham, author of The Mad, Mad World of Climatism and Outside the Green Box, speaking on Climate Science and the Myths of Renewable Energy . Buy your tickets onllne HERE, and click here for more information.
Regional Climate Impacts of a Possible Future Grand Solar Minimum
This paper investigates the effects of a future grand solar minimum on global regional climates using a global climate model. The modeling only considers changes in the ultraviolet radiation component of the total solar irradiance (TSI). It does not consider the indirect effects of solar flux on clouds. The paper shows results for two scenarios. In experiment B, the ultraviolet component of solar irradiance declines by 1.76 W/m2 or 6.4%, while TSI declines by 0.129% with no change to the non-ultraviolet component. The global cooling with respect to a base case for the period 2050 to 2099 was only 0.12 °C. The regional cooling of Northern Europe, Northern Asia and Eastern North America during winters for the period 2050 to 2099 were 0.75 °C, 0.53 °C and 0.43 °C, respectively. For comparison, the expected anthropogenic CO2 warming expected from 2010 to the 2075 (the mid-point of the time range) assuming a transient temperature response of 0.85 °C (determined here) is 0.44 °C. Therefore, if the sun has no effect on cloud cover, which is unlikely, Northern Europe winter temperatures would decline by 0.31 °C by 2075. The ultraviolet solar irradiance is linked to modulation of the Arctic and North Atlantic Oscillations. The solar minimum reduces the solar ultraviolet heating of the tropical stratosphere, which changes the subtropical stratospheric winds and modifies the equator-to-pole temperature gradient. The signal is propagated poleward and down through the troposphere. See the open source paper here. h/t Ken Allen.
Half of Arctic Ice Loss in Due to Natural Cycles
A major paper by Ding et al published in Nature Climate Change that studied natural and man-made Arctic warming said that a decades-long natural warming of the Arctic climate might be tied to shifts as far away as the tropical Pacific Ocean. The authors used several climate models and different reanalysis products. The models were adjusted to observed wind fields. The authors find that summertime [air] circulation contributes to as much as a 60% of the sea ice loss since 1979 and that about 50% of the circulation change and the associated warming over Greenland are attributable to internal variability originating from the tropical Pacific Ocean. They attribute 30-50% of sea ice loss to internal variability. The paper concludes The potentially large contribution of internal variability to sea ice loss over the next 40 years reinforces the importance of natural contributions to sea ice trends over the past several decades. The similarity of high latitude circulation variability associated with sea ice loss to the teleconnections with the tropical Pacific suggests a contribution of sea ice losses from SST trends across the tropical Pacific Ocean. The paper ignored the effects of black carbon on ice and snow. See a UK DailyMail article here and the paper here.
Climate Response Time to Double Carbon Dioxide
The IPCC 's fifth assessment report claims that equilibrium climate sensitivity (ECS) is likely in the range of 1.5 to 4.5 °C. The ECS is defined as the global average surface temperature change due a doubling of carbon dioxide after allowing the oceans to reach temperature equalization. But how long does it take for the oceans to reach equilibrium? This can only be estimated by climate models. One study gives this graph, which shows the time to temperature equalization for the northern and southern hemispheres. It shows that 95% of the equilibrium temperature response occurs in about 900 years in the northern hemisphere and 3300 years in the southern hemisphere. Global temperature will reach 95% of temperature equalization due to a doubling of CO2 in about 2200 years. See the paper Time Scales of Climate Response here. The value of money at a 4% real discount rate declines to 0.0000000000000002% in 1000 years. Events on these time scales are irrelevant to current policy decisions, so the IPCC 's emphasis on ECS is misleading. The transient climate response TCR is the temperature change at the time of CO2 doubling. The most realistic empirical estimate of TCR, which takes into account of the urban warming and the millennium warming cycle is 0.85 °C in 125 years.
Heartland 12th Conference on Climate Change
The Heartland Institute is holding the 12th International conference on climate change in Washington, DC today and tomorrow, March 23-24, 2017. The Heartland newsletter says the conference presents scientists, economists and US elected officials who will explain how and why the Trump administration should reset climate policy away from the fake science and alarmism of the Obama years and toward real science and data. Watch live video streaming of the conference here.
Lifetime Performance of World 's First Offshore Wind Farm
The world 's first offshore windfarm is now being dismantled in Denmark. It operated for 25 years from 1991 to 2016 with a lifetime capacity factor of 22%. Cost and operating statistics of its operation lead to the conclusion: While turbines are getting larger, able to operate at lower wind speeds, and improving their capacity factors, the total lifecycle cost per unit of energy provided from offshore wind has not perceptibly decreased from 1991 to 2015. Higher costs of O&M for larger turbines farther offshore seems to consume savings from higher capacity factors. See here.
CliSci # 254 2017-03-12
California Megaflood: Lessons from a Forgotten Catastrophe
Geologic evidence shows that truly massive floods, caused by rainfall alone, have occurred in California every 100 to 200 years .. during the winter of 1861-62. This disaster turned enormous regions of the state into inland seas for months, and took thousands of human lives. The costs were devastating: one quarter of California 's economy was destroyed, forcing the state into bankruptcy .. Such floods are likely caused by atmospheric rivers: narrow bands of water vapor about a mile above the ocean that extend for thousands of kilometers.
In 1861, farmers and ranchers were praying for rain after two exceptionally dry decades. In December their prayers were answered with a vengeance, as a series of monstrous Pacific storms slammed one after another into the West coast of North America, from Mexico to Canada. The storms produced the most violent flooding residents had ever seen, before or since .. See here.
The Permian-Triassic Mass Extinction Was Caused by an Ice Age
Scientists had previously thought that the Permian-Triassic mass extinction that resulted in the extinction of 95% of marine species about 250 million years ago was caused by global warming. New research published by scientists from Switzerland show that the mass extinction was actually caused by an ice age induced by volcanic eruptions in Siberia. The volcanism reduced the amount of solar radiation reaching the Earth 's surface. The ice age preceded the global warming by 500,000 years. The researchers discovered that the mass extinction occurred when sea levels fell during the glaciations of an ice age. The ice age which lasted 80,000 years was sufficient to cause the extinction. The researcher used the radioactive decay of uranium to accurately date sediments in China. See ScienceDaily here.
New Satellite Temperature Dataset Paper from UAH Published
The technical paper explaining the methodology and results of the new version 6 of the University of Alabama in Huntsville (UAH) satellite temperature dataset was published online March 7, 2017. The UAH ver. 6 reduced the global lower troposphere (LT) temperature trend from 1979 to 2016 by 0.031 °C/decade to 0.123 °C/decade compared to the previous UAH ver. 5.6. The global 21st century LT temperature trend from 2001 to 2016 was reduced by 0.076 °C/decade to 0.088 °C/decade. The UAH ver. 6 has higher spatial resolution, a new method for grid-point averaging, a new multi-channel method of computing the LT temperatures and a new method to correct for diurnal drift. The submitted paper is here.
Arctic Ocean Sea Ice Variability Over the Last Ten Thousand Years
A paper by Stein et al published in February 2017 in the Journal of Quaternary Science shows that Arctic sea ice variability during the last 10,000 years, during the Holocene, is modulated by variations in solar activity. The study presented sea ice records from two sediment cores recovered from the Arctic ocean. The record shows a significant increased sea ice extent during the last 4,500 years. The sea ice millennial variability was caused by changes in ocean currents from the Pacific ocean into the Arctic ocean and the long-term decrease in solar insolation. The short-term centennial variability is related to solar forcing. The 20th century sea ice extent was greater than most of the Holocene period except for the Little Ice Age. See an article by Kenneth Richard here and the abstract here.
Examining the Social Cost and Benefit of Carbon Dioxide
Climate scientist Patrick Michaels provided testimony before the U.S. House of Representatives Committee on Science, Space and Technology on February 28, 2017 about the calculation of the Social Cost and Benefit of Carbon Dioxide (SCC). His testimony shows that the US Interagency Working Group (IWG) used too high and outdated estimates of climate sensitivity despite at least 16 new studies that show much lower values. Using more current values from empirical studies, the SCC in the DICE model falls by 30-50% and in the FUND model it falls by over 80%. The climate models over-warm the bulk atmosphere by a factor of 2.5. Climate models are tuned by adjusting parameters to roughly match the late 20th century warming from 1975, thereby misallocating natural warming to greenhouse gas warming. A 300 ppm increase in CO2 causes a 30% increase in the growth of most crops. Two of the models used by the IWG do not contain the any significant benefits of CO2 fertilization and the effect in the FUND model may be up to a factor of four too small. Sea level rise in the DICE model are far higher than mainstream projections. The SCC would likely be negative if the models used parameters from the current scientific literature. The IWG estimate of SCC is unsupported by the robust scientific literature . See the written testimony here.
Aerosol-driven Increase in Arctic Sea Ice 1950 - 1975
A paper published by Gagn et al in February 2017 shows that the Arctic sea ice extent grew substantially between 1950 and 1975, contrary to earlier observational datasets that show weak inter-annual variations. The scientists used two new blended datasets mostly based on in-situ observation from the eastern Arctic. The sea ice increase is consistent with the observed Arctic cooling from 1940 to 1970. The authors used climate model simulations from the Canadian climate model CanEMS2 to suggest that the cooling was primarily due to increasing aerosols and with a smaller contribution from natural forcings. The new observational datasets indicate that Arctic sea ice concentration were as low in the early 1950s as during recent decades. See a discussion here and the paper here.
CliSci # 253 2017-02-23
Baffin Bay + Kane Basin Polar Bear Population Estimate Increased 42% from 1997
A new report of polar bear population shows a 42% increase in the estimated subpopulations of Baffin Bay plus Kane Basin, located between NW Greenland, and Baffin and Ellsemere Islands. Environment Canada assessed these area in 2014 as data deficient for Kane Basin and likely declining for Baffin Bay. A re-calculation of the 1995-97 data for Kane Basin increased the 1997 estimate from 164 to 224 polar bears, and the current estimate is 357. The Baffin Bay estimate increased from 2074 in 1997 to 2826 in 2013, however the report cautions that the estimates are not directly comparable due to data limitations. Dr. Susan J. Crockford writes that she expects a revised 2015 global estimate of something like 23,000-33,000 depending on how all the results are interpreted. The 1980 global estimate was about 22,000. See here.
China ENSO-related Cyclic Storms Are Driven by Solar Activity
A paper by Zhu et al 2017 shows that storms in central China are closely correlated with ENSO activity and occur on a significant 500-y cycle related to periodic solar activity. The authors used magnetic minerals preserved in a stalagmite to create a record of storm activity over the last 8,600 years. Strong storms correlate with low solar activity and weaker storms correlate with high solar activity. The paper finds that the cyclic storms are controlled by the coupled atmosphere ˆ’oceanic circulation driven by solar activity. See the abstract here.
Solar and Tropical Ocean Forcing of Climate Change in East Asia
A study by Park, 2017 compared a high-resolution sediment record from South Korea to total solar irradiance (TSI) and sea surface temperatures. The sediment record shows important late Holocene cold events associated with low sunspot periods such as Oort, Wolf, Sp ¶rer, and Maunder Minimum. The comparison between the temperature reconstruction and TSI suggests that solar activity drove Holocene variations in both East Asian Monsoons and ENSO. See the abstract here.
Homogenisation Increases Warming Trends in Australia and Colorado
Much of the warming reported by government temperature indexes are strongly affected by artificial warming known as the urban heat island (UHI) effect. Rural stations trends are often increased to match urban warming trends. In Australia, the warming trend from 1885 at lighthouses was measured at 0.43 °C/century, while the trend at cities are 0.82 °C/century. The lighthouse trends were increased through the homogenization process to be similar to the trend of the cities according to a study by Marohasy and Abbot.
A study by Monte Naylor of the temperature record for Colorado shows that NOAA had adjusted rural station trends upward to match UHI contaminated temperature history of the Fort Collins station. The actual warming trend as estimated by Naylor is 0.82 °C/century. The NOAA homogenized trend is 1.93 °C/century, or 235% of Naylor 's estimate. See here.
Hurricane Activity Declining over Last 26 Decades Linked to Solar Activity
A study published in Journal of Atmospheric and Solar-Terrestrial Physics by Rojo-Garibaldi et al shows an analysis of hurricanes in the Gulf of Mexico and the Caribbean Sea, and sunspots occurring from 1749 to 2010. The authors compiled a database of hurricanes by combining the results of several studies. The abstract says the total number of hurricanes is declining. This decline is related to an increase in sunspot activity. Spectral analysis shows a relationship between hurricane oscillation periods and sunspot activity. Hurricane activity was decreasing while sunspot numbers were increasing. It is quite likely that the number of hurricanes in the beginning portion of the record were under-reported when data acquisition was poorer than at the end of the record. If some hurricanes were missed at the beginning of the record, the decline would be greater. Climate alarmist including Al Gore have repeatedly claimed that warming will cause more hurricanes, but there is no evidence to support the claim. See a review of the paper and a graph of the Gulf of Mexico and the Caribbean Sea hurricane count here and the paper here. A graph of global hurricane frequency from 1970 is here.
Britain lost £450 Million by Paying Biomass Subsidies in 2015
The Times of the UK reported that Britain is wasting hundreds of millions of pounds subsidising power stations to burn American wood pellets that do more harm to the climate than the coal they replaced, a study has found. Britain imported 7.5 million tonnes of wood pellets last year, mostly from the US and Canada. The Drax power station received more than £450 million in subsidies in 2015 for burning the wood pellets. Biomass is considered carbon neutral by the EU because the trees that are cut down are replanted. A report by Duncan Brack says this process could take centuries. This is too late to prevent climate change over the coming decades. The report shows that facilities burning wood for energy, other than saw-mill residues or waste, will be increasing carbon dioxide emission for decades or centuries. Burning wood releases 18% more CO2 than burning bituminous coal. See here.
CliSci # 252 2017-02-11
Climate Scientists Versus Climate Data
Dr. John Bates retired November 2016 from his job as a principle scientist at NOAA 's National Centers for Environmental Information (NCEI). He wrote NOAA 's procedure for quality checking, documenting and archiving climate data. Dr. Bates wrote a blog post that sharply criticized Tom Karl, director of NCIE, for not archiving or documenting a critical climate dataset that was introduced in a paper Karl et al 2015 (K15) published in the journal Science. The study had the effect of slightly reducing the sea surface temperature (SST) trend from 1980 to 1996, graph here, but increasing the SST trend from 1997 to 2014, graph here, where the trend during the hiatus period increased from 0.014 °C/decade to 0.065 °C/decade. The SST trend from 1980 to 2016 increased by only 0.006 °C/decade. Bates wrote I was dumbstruck that Tom Karl, the NCEI Director in charge of NOAA 's climate data archive, would not follow the policy of his own Agency nor the guidelines in Science magazine for dataset archival and documentation. The Karl data never went through any operational readiness review so Bates says it is virtually impossible to replicate the result in K15. Bates writes we find Tom Karl 's thumb on the scale pushing for, and often insisting on, decisions that maximize warming and minimize documentation. See here.
David Rose wrote an article in the UK Mail titled Exposed: How world leaders were duped into investing billions over manipulated global warming data . The K15 paper was dubbed the Pausebuster ' paper and was very influential at the Paris climate conference. The paper adjusted floating buoy temperature data to better match data from ship engine room water intakes. The K15 paper also made smaller changes to the land temperature record. Bates say the software used to process the figures was bug-ridden and unstable. The article says another version of the sea surface data, ERSSTv5, is being prepared that will fix errors in the ERSSTv4 based on K15 by changing the buoy adjustments and including some satellite data and Argo buoy network data. This will result in a reduction in the recent global warming trend. See here. Note, the graph comparing NOAA and Met Office temperature data in the Rose article is misleading as the temperature separation is due to the two indexes using different base periods.
One Thousand Years of Summer Temperatures in Northeastern Canada
CO2 Science reviewed at paper Naulier et al 2015 that presented a summer temperature reconstruction for eastern Canada based on oxygen isotopic series from tree rings. The oxygen isotope is considered a more reliable proxy than tree ring width. The temperature graph is here. The millennial record revealed a cooling trend to 1900, warming to 1950, 1970s cooling and warming to 2000. The warmest period was during the Medieval Warm Period at about year 1000, and a cold period extending from the early 15th century through the end of the 19th century, representing the Little Ice Age . There is nothing unusual, or unprecedented about the current level of warmth in northeastern Canada. The paper reports that their data suggest that "solar radiation was the most influential forcing on Tmax changes in the studied region," further noting that "low temperature periods were always associated to low solar radiation periods (p < 0.05)." See the review here.
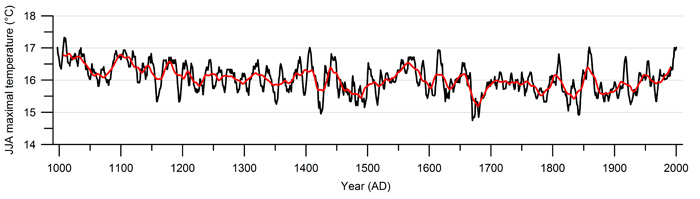
U.S. Wind Energy Policy
The total cost of the US wind production tax credit subsidy for wind power in the years 2016-2020 is estimated at US$23.7 billion. Public opposition to wind turbines standing over 500 feet (150 m) near homes has significantly intensified. The Obama administration lost three court cases involving wind power for failing to comply with laws governing wildlife protection. The Department of Energy has issued reports that contradicted experts who have testified that wind turbines adversely affect health. Wind turbines adversely affects military radar, but the administration prohibited the Secretary of Defense from objecting to any wind energy project unless it produced an unacceptable risk to national security. The blog Master Resources reviews this and will make specific recommendation to the new Trump administration to fix these issues. See here.
Siberian Arctic Black Carbon Sources
Black carbon (BC) deposits on ice and snow are a major driver of climate warming in the Arctic, which is greatly underestimated in climate models. A study published in the Proceedings of the National academy of Sciences used a transport model and observations to find that the major sources of BC in the Russian Arctic are domestic heating sources (35%) and transportation (38%), with gas flaring (6%), power plants (9%) and open fires (12) being minor sources. Understanding the BC source attribution is required to develop reliable mitigation strategies to reduce BC impact in the Arctic. Black carbon, or soot, contributes to ice loss by increasing the absorption of sunlight. High-latitude sources are especially important. China releases more BC than Siberia, but reductions in China would have much less impact than reductions in the Arctic. See the abstract here and a news release here.
Solar Activity Drives Sea Levels, Tropical Storms and River Discharge
Dr. L ¼ning and Dr. Vahrenholt discuss three new papers related to solar forcing. One paper Decadal variability of European sea level extremes in relation to the solar activity shows the autumn and/or winter sea level extremes vary with the 11 year solar cycle in Venice, Trieste, Marseille, Ceuta, Brest, and Newlyn. Another paper, Solar forcing over the last 1500 years and Australian tropical cyclone activity uses a 1500-year tropical cyclone activity index to show that solar forcing largely drives decadal, interdecadal, and centennial cycles within the tropical cyclone record. A third paper Evidence of a decadal solar signal in the Amazon River: 1903 to 2013 compared a 1903-2013 record of the Amazon River discharge to solar activity. The paper reports the decadal flow cycle is anti-correlated with solar sunspot cycle. The authors write This relationship persists through time and appears to result from a solar influence on the tropical Atlantic Ocean. See here.
CliSci # 251 2017-01-29
Carbon Circular Logic
The BERN model is an earth system model used to convert estimates of carbon dioxide emissions to carbon dioxide accumulating in the atmosphere by estimated the absorption by carbon sinks. This model is used to generate CO2 concentration forecasts from the emission scenarios used in climate models. As a minimum, the BERN model should be able to reproduce past CO2 concentrations from CO2 emissions data, but it badly fails this test. Dr. Clive Best calculated the CO2 levels implied by the BERN model from the CO2 emissions from fossil fuel use, cement production and land use changes resulting in this graph. The BERN model gives goods agreement with the Dome C ice core data of CO2 levels up to 1940, then it give much higher CO2 levels than measured at Mauna Loa. A paper by Millar et al shows very similar results. Dr. Best explains that the discrepancy is likely due to the BERN model 's failure at account for the CO2 fertilization effect that is greening the earth and resulting in a growth plant CO2 sink. Dr. Best writes This makes it clear that any fertilisation effect was also ignored by ESMs. This likely means that IPCC projections of future CO2 levels based on the Bern model are too high. See his post here.
Warming ' and The Pause ' Explained By Wind, Upwelling And Mixing
The amount of cool ocean water upwelling has a dramatic effect on sea surface temperatures. Wim R ¶st presents maps showing that during the warming pause ' (2001-2015) ocean areas that cooled the most relative to the previous warming period (1986-2000) are those area that were windiest. Strong winds cause strong ocean upwelling, as well as more evaporation, both of which cause sea surface cooling. There was increased wind speed in the eastern Pacific during the pause ' corresponding to cooler temperatures while the opposite occurred in the north Atlantic. Global wind speed were higher during the pause ' than during the previous warming period. Wim R ¶st suggest that this is an overlooked negative feedback, where more warmth leads to more wind, more upwelling causing cooling that offsets some of the initial warming. See here.
Trump 's NOAA Administrator Must Address the Temperature Record Controversy
Dr. Spencer writes NOAA has been actively adjusting ' the thermometer record of global temperatures over the years by making the present warmer, and the past colder, leading to an ever increasing upward temperature trend. Numerous technical articles show that the temperature record is contaminated by the effects of urbanization and by inappropriate temperature adjustments. A study resulting from the surface station project headed by Anthony Watts here shows that the NOAA adjusted USA temperature record trend from 1979 to 2008 is 59% greater than that determined by the stations compliant with NOAA 's standards. Spencer says that President Trump must select a new NOAA administrator who will reexamine these procedures. The new NOAA Administrator needs to address this issue head on, and not whitewash it. See here.
800 Years of Summer Temperatures in Scotland From Tree Rings
A study published is Climate Dynamics this month used living and fossilized pine tree rings to reconstruct 800 years of summer temperatures in Scotland. The abstract reports that the recent summer-time warming in Scotland is likely not unique when compared to multi-decadal warm periods observed in the 1300s, 1500s, and 1730s Prominent cold periods were identified from the sixteenth century until the early 1800s agreeing with the so-called Little Ice Age extreme cold (and warm) years observed in NCAIRN appear more related to internal forcing of the summer North Atlantic Oscillation. See here.
Climatic Variability in Northern China over the Last 2200 Years
A paper by Li et al 2017 presented pollen-based temperature and precipitation reconstructions of northern China over the last 2200 years. The reconstruction shows that solar activity may play a key role in driving the climatic fluctuations in NC [northern China] during the last 22 centuries, with its quasi ˆ¼100, 50, 23, or 22-year periodicity . The reconstructions were compared to social-economic, and geo-political historical records. The authors find that precipitation (67.4%) may have been more important than temperature (32.5%) in causing the overall agro-ecological and macro-geopolitical shifts in imperial China . See here.
Petrified Tree Rings Show Solar Cycles 300 Million Years Ago
A paper published this month in the journal Geology used petrified tree ring from the Permian period in Germany to show an 11-year cyclic period. This is the earliest direct evidence of the 11-year solar cycle. The abstract says sunspot activity caused fluctuations of cosmic radiation input to the atmosphere, affecting cloud formation and annual rates of precipitation, which are reflected in the tree-ring archive. This demonstrates the long-term stability of the solar cycle for at least the last 300 million years. See Science News here, the abstract here.
CliSci # 250 2017-01-16
The Atmospheric Temperature Pause
The December 2016 global temperature anomaly from the average of two analysis is 0.20 °C above the average of 1981 2010. The large El Ni ±o event is over and we wait to see if it will be followed by a La Ni ±a event. The satellite measured temperature of the lower troposphere to the end of 2016 from the average of the University of Alabama in Huntsville and Remote Sensing Systems analysis is here. The temperature trend from December 1997 to December 2016 is 0.045 ± 0.043 °C/decade at the 95% confidence interval. The slope could be as low as 0.002 °C/decade. According to the satellite data, 2016 was a statistically insignificant 0.02 °C warmer than 1998, which was another strong El Ni ±o year.
Climate Models Overestimate the Aerosol Effect on Clouds
A paper published this month in Atmospheric Chemistry and Physics shows that climate models overestimate the effects of aerosols on cloud liquid volume. The authors simulated warm clouds at the southern Great Plains (SGP) measurement site using a cloud resolving model (CRM) tuned to the measurements from the site, and compared the results to a single column version of a climate model (CAM). The liquid water volume (or liquid water path, LWP) increase substantially with aerosol loading in the climate model while that in the cloud resolving model did not increase. The abstract says The increase of LWP in CAM is caused by a large decrease of the autoconversion rate when cloud droplet number increases. In the CRM, the autoconversion rate is also reduced, but this is offset or even outweighed by the increased evaporation of cloud droplets near the cloud top, resulting in an overall decrease in LWP. Our results suggest that climate models need to include the dependence of cloud top growth and the evaporation/condensation process on cloud droplet number concentrations. Climate modelers use aerosols as a huge fudge factor to match history. These results shows that aerosols no not affect cloud cover as much as previously assumed. This implies the decrease in global temperatures from 1940 to 1975 was not caused by human-caused aerosols but by natural causes. See the abstract here.
Greenland Ice Sheet Surface Mass Balance Is 120 Billion Tonnes Above the 1990-2013 Average
Danish Meteorological Institute publishes a real time chart of the Greenland ice sheet surface mass balance, which records the balance between ice gain from snowfall and ice loss from melting and sublimation. See the chart here. The surface mass balance has increased due to an increase in snowfall, likely due to increased ocean evaporation resulting from lower sea ice extent in the Arctic. The total mass balance of the ice sheet would not change if the surface mass balance grows by the same amount as the calving from glaciers into the ocean as icebergs. Over the last decade, the calving from glaciers has exceeded the surface mass balance by about 200 Gt/yr, so the ice sheet was losing mass. That might change if the surface mass balance continues to grow at its current rate.
Coral Fossils Show Evidence of Immunity to Predicted Ocean Acidification and Warming
A paper published in Scientific Reports in January 2017 by Stolarski et al shows a comparison of skeletal structures of living Acropora corals with fossilized corals over many periods of the last 40 million years. Over this very long period of time the corals have experienced major changes in atmospheric CO2 concentrations and ocean temperatures. The oceans also had a dramatically changing Mg/Ca ratio. The analysis shows that the reef building corals were not harmed by the fluctuation CO2 levels, but has maintained its distinct skeletal bio-mineralization pattern for at least 40 million years. The authors write, Such remarkable evolutionary stability exists despite major global geochemical fluctuations . The skeletal formation process of corals is strongly biologically controlled and is uninhibited by changes in temperature or seawater pH ocean acidification. See a review at CO2 Science here.
Satellite Reveals End of Unending N. California Drought
The New York Times reported in May 2016 the governor of California imposed permanent water conservation measures. The governor claimed that the drought may never end due to climate change. The idea that drought is caused by global warming is not supported by scientific evidence, as warming will cause slightly greater evaporation and precipitation rates. USA Today reported on January 12, 2017 that 20 inches (51 cm) of rain and 12 feet (3.66 m) of snow has ended the 5-year drought in northern California, see here. Dr. Roy Spencer published satellite images of California that show the dramatic changes which have occurred since the same date three years ago. The images show the brown land in 2014 are now green and there is widespread snowpack, see here.
Climate and Solar Activity
There have been 132 peer-reviewed scientific papers published in 2016 that show a significant solar influence on climate and at least 7 paper published in this year show similar results. A recent paper Zawiska et al 2017 presents a temperature reconstruction for the last millennium from lake sediments in Eastern Norway. The results show that summer temperatures were 1 to 2 °C warmer than the mean millennial temperatures during the 11th, 13th, 15th and 20th centuries and 1 to 2 °C cooler during the 12th, 14th, 17-18 centuries. The authors write The three minor cooling periods were reconstructed in the first half of the millennium: 1050 1150, 1270 1370, 1440 1470 CE, that coincide with solar activity minima: Oort, Wolf, and Sp ¶rer respectively. Furthermore, a two peaked cooling period in the second half of the millennium was identified that coincided with the [Little Ice Age] LIA. These changes co-occurred with the prevailing negative [North Atlantic Oscillation] NAO index. Maunder solar minimum caused a very deep negative NAO index phase during the LIA. Climate warming began in 1800 following the Little Ice Age. Temperatures increased very fast, from 8.5 to 12.8 °C during the first 75 years, but in the 20th century the increase became less pronounced. The warming correlates with the positive North Atlantic Oscillation index and increased solar activity. The Zawiska paper is here. See a summary of this and other recent papers by Kenneth Richard here.