A PDF version of this article is here.
By Ken Gregory June 22, 2017
A website called Skeptical Science.com ' is popular among climate alarmists. The website alleges to refute claims by climate skeptics that global warming is not a crisis. The website features a list of 10 Most Used Climate Myths by climate skeptics at the top left part of the webpage. I review and rebut each rebuttal of the 10 alleged myths.
1. Climate's Changed Before
The webpage claims that carbon dioxide (CO2) and methane changes were involved in most of the climate changes in Earth 's past. When CO2 levels jumped rapidly, the global warming that resulted was highly disruptive . This falsely implies that the CO2 levels changes during the last billion years caused the temperature changes. In all cases the temperature changes occur first, followed by CO2 (and methane) changes. In fact, the increase in temperatures at the end of the last four ice ages were in part caused by low CO2 level, and by increasing solar insolation due to the Earth 's precession. Warming causes CO2 to outgas from the oceans, and cooling causes the oceans to absorb more CO2. Global cooling started when CO2 levels were high at the end of each of the past three interglacial period, proving that the solar insolation changes dominated over the small warming effect of CO2. Contrary to the webpage, mass extinctions were not caused by warming temperatures. They were caused by large asteroid collisions with the Earth that caused large quantities of atmospheric dust that blocked sunlight and resulted in rapid global cooling.
See here to learn how low CO2 causes warming. See here and here to learn that temperature changes lag CO2 changes by 800 to 1000 years during the last 700,000 years.
2. It's the Sun
The webpage claims Over the last 35 years the sun has shown a cooling trend. However global temperatures continue to increase. If the sun's energy is decreasing while the Earth is warming, then the sun can't be the main control of the temperature. A graph of Total Solar Irradiance (TSI) is presented that shows declining values since 1960. This is a classic straw man fallacy, as no serious climate skeptic claims that TSI is the main driver of climate change since the beginning of the 20th century. The IPCC uses this misdirection also by claiming that the only natural cause of climate change is TSI, which is also called the solar constant. It is disingenuous to claim that the only natural cause of climate change is TSI which is (almost) constant when the historic record show dramatic climate change before humans could have had an influence.
The graph of TSI on the webpage is obsolete and its shape correspond more to sunspot number than solar irradiance. The Solar Forcing Working Group of PAGES (Past Global Changes) group published the most recent estimates of TSI here. The graph here show the TSI increased from 1990 to a peak in 1992, which is the highest in 11,000 years.
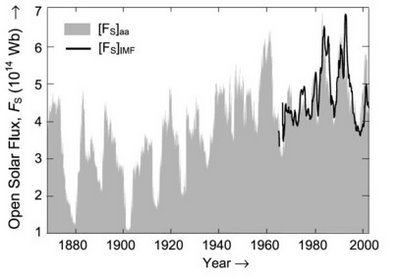
The Sun causes climate change by affecting cloud cover and ocean oscillations. The solar magnetic flux has increase from 1900 to 1991, graph here, shielding us from galactic cosmic rays that help create aerosols that seed clouds. Therefore, increasing solar activity reduces cloud cover allowing more sunlight in to warm the surface. The ultra-violet (UV) portion of the solar spectrum has increased by a factor of 2 since the Maunder Minimum, a period of low solar activity which corresponds to the Little Ice Age. The UV intensity changes by about 7% over a solar cycle. The UV changes affect ozone heating of the stratosphere that affects wind speed, cloudiness and surface temperatures. See here to learn how the Sun affect climate. See here to see correlations of solar activity to climate. See here for a summary of the solar magnetic flux and UV effects on climate.
Ocean circulation changes oscillate on several time scales, such as the millennium oscillation, the Pacific Decadal Oscillation (PDO) and ENSO. These changes are driven by changes in salinity due to solar-driven evaporation and winds due to uneven solar heating of the atmosphere and solar heating of the ocean surface. See here and here.
TSI, solar magnetic flux and UV radiation all peaked in 1991. The solar warming effects are expected to peak 10 to 12 years later due to the large heat capacity of the oceans, or about 2002. There has been very little warming since 2001 according to weather balloon and satellite date, see satellite temperature graph here.
3. It 's Not Bad
The webpage gives a list of relationships claiming that most climate change impacts will confer few or no benefits, but may do great harm at considerable cost.
CO2 is plant food, and more CO2 increases crop yields and has caused a greening of the Earth. There are literally thousands of studies that show the positive effects in increasing CO2 on plants. A study by Idos published by CO2Science shows the monetary benefit of the atmospheric CO2 fertilization effect of forty-five crops that supplied 95% of the total world food production over the period 1961-2011. The study shows that the annual total monetary value of this benefit grew from $22.7 billion in 1961 to over $170 billion by 2011, amounting to a total sum of $3.9 trillion over the 50-year period 1961-2011, all figures in US2016 dollars. See here. The Skeptical Science webpage claims that floods and droughts will disrupt agriculture, but the IPCC shows that there has been no increase in floods with warming and the global drought levels from the Global Integrated Drought Monitoring and Prediction System show a small decline, see graph here. A major study (Zhu 2016) found a widespread increase of greening over 25% to 50% of the global vegetated area from 1982 to 2009, with the CO2 fertilization effect explaining 70% and warming explaining 8% of the observed greening trend, respectively. See our Climate Change Science essay here, and CO2 and Plant Growth section here.
The webpage claims that deaths attributable to heatwaves are expected to be approximately five times as great as winter deaths prevented. This contradicts the peer-reviewed literature which shows that warming will prevent far more winter dead than it will cause deaths from excess heat. The death rate in Canada in January is more than 100 deaths/day greater than in August. See graph here. Cold weather kills 20 times as many people as hot weather, according to an international study analyzing over 74 million deaths, see here. A recent study analyzed relationship between climate and 5961 infectious disease epidemics in China over the period 1370-1909 AD. The scientist found that in China a standard deviation decrease in temperature (about 0.8 °C) caused an increase of 162 epidemic outbreaks. The abstract says cooling drove up epidemic outbreaks in northern and central China . See Health and Animals here.
The webpage claims the polar melting will cause the loss of polar bear habitat , but polar bears numbers have not declined in the last 30 years. Polar bears are far more threatened by cold conditions and too much sea ice which reduces the number of seals, the polar bears' main food source. See here.
The webpage claims that ocean acidification may have severe destabilising effects on the entire oceanic food-chain but this is not supported by evidence. The researchers at Woods Hole have spent four years doing a comprehensive study at Palau Rock Islands in the far Western Pacific, where pH levels are naturally more acidic (which is big-government speak for less alkaline). They found a diverse healthy system they describe as thriving with greater coral cover and more species , see here. CO2Science.org maintains an extensive database of studies that record changes of life characteristics of marine organisms in response to various ocean pH levels. The maximum expected decline of ocean pH is 0.3 which is expected to occur about 2100 after which pH values start a slow recovery. The linear trend of all the data to 0.3 pH change is actually positive, indicating an overall beneficial response of the totality of the five major life characteristics of marine sea life to ocean acidification, see here. A recent study found that calcifying species living near CO2 vents were thriving due to increased food source from algae which benefits from CO2 fertilization, see here.
Sea level rise is expected to remain at about the current rate of 20 cm/century. Analysis by the FUND integrated assessment model shows that with adaptation measures the cost of this slow rise is very small.
The FUND model projects that Canada will benefit from CO2 emissions by $186 billion/year by 2100. Using a realistic climate sensitivity of 1.0 °C for a doubling of CO2, the FUND model determines a best estimate global social net benefit of CO2 emissions of about US$17/tCO2 [likely 11 to 19 US$/tCO2] at a 3% real discount rate. See here. This is very beneficial.
4. There Is No Consensus
The webpage cites several studies that suggest there is high agreement of about 97% among climate scientists that greenhouse gas emission is causing dangerous climate change. In fact, none of the cited studies show this. In general, they only show that most climate scientists agree that there has been some warming since the beginning of the 20th century and that human activity has contributed some part of that warming. There is no consensus on the magnitude of the greenhouse contribution to the warming, and no consensus that the warming will be dangerous. So far, the warming has been beneficial.
The Oreskes 2004 study reviewed 928 papers and found that 75% of these either implicitly or explicitly accepted the consensus view. This includes writing mitigation proposal or evaluating impacts of climate change. These papers do not study the causes of warming.
The Doran 2009 study sent a survey to 10, 257 scientist to which 3,146 responded. The important question was Do you think human activity is a significant contributing factor in changing mean global temperatures? They selected 77 responses and found that 75 answered Yes , giving 97.4% of 77 answers. Significant in science usually means 5% to 10%. There was no mention of greenhouse gases nor of any harmful effects. The answers implies that human activity, including urban development and soot on snow, causes at least 5% of climate change. This is not the IPCC position.
The Cook 2013 study reviewed 11,958 peer-reviewed climate abstracts and assigned them to 7 categories. They found that 64 abstracts explicitly endorsed that more than 50% of warming was caused by humans, or 0.54%. Another 923 abstracts explicitly indicate that humans have caused some warming without quantifying, or 7.7%. They claim that another 2911 abstracts, or 24.3% implicitly suggest that humans cause some warming by discussing the effects of warming or mitigation. There is no mention of any harmful effects of warming. None of these studies show that there is a consensus of the amount of warming caused by humans nor that warming is dangerous. See our report here, and see a table summary here.
A George Mason University survey of 4,092 members of the American Meteorological Society (AMS) on climate change attitudes in the meteorological community shows that only 67% believe climate change is mostly or entirely caused by humans. Fully 33% either believe climate change is not occurring, is mostly natural, or is at most half-natural and half-man-made. See here.
5. It 's Cooling
The webpage quotes H. Svensmark In fact global warming has stopped and a cooling is beginning. No climate model has predicted a cooling of the Earth quite the contrary. And this means that the projections of future climate are unreliable. This statement was made in September 2009. The Remote Sensing System (RSS) temperature record show a significant best fit temperature trend over 12 years to September 2009 of -0.13 °C/decade. Svensmark and others did not predict that the cooling would continue for many decades, rather they note that climate models do not include natural climate change so they fail to predict cooling intervals of this length. Climate models do include random climate variability, but the probability of a cooling trend exceeding 15 years is vanishingly small. However the RSS temperature record shows a period of 18 years 2 month to December 2015 with a declining temperature trend. This can never occur in a climate model, so as Svensmark correctly says, the cooling over this long period of time means that the projections of future climate are unreliable.

6. Models Are Unreliable
Climate model warming is driven almost exclusively by greenhouse gas forcing, modified by occasional volcanoes and changing aerosols. The climate effect of aerosols from pollution is a huge unknown, so modelers use aerosols as a fudge factor to roughly match the global average temperature trends, but they fail to match the 60-65 year climate cycle and the 1998 2015 pause in global warming. The solar activity has been increasing since the middle of the Little Ice Age (1750) which was also the start of the Industrial Revolution and the beginning of CO2 emissions. The fact that climate models roughly match the temperature recovery from the Little Ice Age does not tell us if the models are correct about the cause of the warming. The growing discrepancy since 2002, when solar induced warming reached a maximum, strongly suggests that the models are far too sensitive to greenhouse gas emissions and that much of the 20th century warming was natural. The models show what the temperature change profile in the atmosphere would be if the warming was caused mainly by greenhouse gases. Dr. John Christy produced a simplified graph of a figure published in the IPCC fifth assessment report reproduced here:

The graph shows the temperature trends in °C/decade of the range of observation in grey, of climate models without greenhouse gases in blue and climate models with greenhouse gases in red at altitudes from the surface up to 50,000 ft. The range of model trends without greenhouse gases well overlay the observations, but the range of model trends with greenhouse gases are far greater than and do not overlay the range of observations. This falsifies the theories employed by the models and proves that the models are unreliable for making projections. See Climate Models here and Computer Models Fail here for more information.
7. Temperature Record is Unreliable
The webpage quotes a study by Anthony Watts In fact, we found that 89 percent of the stations nearly 9 of every 10 fail to meet the National Weather Service 's own siting requirements that stations must be 30 meters (about 100 feet) or more away from an artificial heating or radiating/reflecting heat source." The study also found the final adjusted US warming trend from 1979 to 2008 is 159% of the warming trend of the stations that are compliant with the NOAA requirements. Therefore, 59% of the reported warming trend is bogus. See here.
The warming due to increasing population density is roughly logarithmic, meaning that a small town that increases its population by 50% will experience the same urban warming as a large city that increases its population by 50%. In fact, a recent study shows the most rapid rate of warming with population increase is at the lowest population densities, while some warming continues with population increases even for densely populated cities. A population density of only 100 persons per sq. km exhibits average warming of about 1.1 °C compared to a nearby unpopulated temperature monitoring location. See here.
The webpage falsely claims that the urban warming is taken into account by weighting (adjusting) readings after comparing them against those from more rural weather stations nearby. They are not compared to truly rural stations but to stations in smaller towns and cities. But if both towns and cities have similar growth rates, the town will have a similar or greater urban warming rate than the city, so the comparison is meaningless. The NASA temperature index does this comparison resulting in 45% of the urban warming adjustments to be in the wrong direction. They increase the large urban center warming rate upward to match the town urban warming rate. All urban warming adjustment should be to reduce the warming rate. See here.
A major study by McKitrick and Michaels shows that if the urban warming contamination of the temperature record were removed we estimated the average measured warming rate over land would decline by about half." See here. There are numerous technical papers that document the urban heat island effect contamination of the temperature record. See Urban Heat Island Effect here. The IPCC agrees with the study that there is a strong correlation of warming to indicators of urban development, but says that it is not due to urban warming, but the locations of greatest socioeconomic development are also those that have been most warmed by atmospheric circulation changes. This means that the IPCC claims large scale atmospheric circulation changes caused by the ENSO and the Arctic Oscillation causes warming over cities but leaves the surrounding countryside unaffected. This is extreme nonsense. Learn about the urban heat island effect here.
8. Plants and Animal Can Adapt
The Skeptical Science webpage quotes the Hudson Institute corals, trees, birds, mammals, and butterflies are adapting well to the routine reality of changing climate. The webpage argues that recent climate change is so rapid that species can 't migrate and adapt. It says humans dominate the bioproductive earth surface and that one study forecast that up to 42% of species in the Southeast Asia region could be consigned to extinction by the year 2100 due to deforestation and habitat fragmentation alone. It also states that during the Quaternary glacial cycles spanning the last million years, there were apparently few climate-related extinctions. It says A large number of ancient mass extinction events have indeed been strongly linked to global climate change and implies that the change was warming. This is not true. Ancient mass extinctions were caused by cooling due to a large quantity of sun-blocking aerosols caused by either an asteroid collisions or volcanoes . It was previously thought that the Permian-Triassic mass extinction was caused by warming but it is now known that is was caused by an ice age that lasted 80,000 years induced by volcanism. See here.
Greenland ice core records show that climate has changed much more rapidly in the past than what occurred during the 20th century. Dr. Don Easterbrook writes, "Temperature changes recorded in the GISP2 ice core ... show that the global warming experienced during the past century pales into insignificance when compared to the magnitude of profound climate reversals over the past 25,000 years. In addition, small temperature changes of up to a degree or so, similar to those observed in the 20th century record, occur persistently throughout the ancient climate record. ... Over the past 25,000 years, at least three warming events were 20 to 24 times the magnitude of warming over the past century and four were 6 to 9 times the magnitude of warming over the past century." Species have adapted well to these large and rapid temperature changes.
The forecasts of future extinction rely on extreme warming forecasts that are not supported by evidence. The temperature rise based on empirical estimates and exponential growth of CO2 gases show that greenhouse gas induced temperature will likely be only 0.6 °C from 2016 to 2100, see here.
New research shows the corals will continue to adapt to future climate changes because of their high genetic diversity. See here.
CO2 fertilization is causing a greening of the earth, with more dense tree cover, which is providing more habitat and shade for animals. A recent paper here found that drylands contain 45% more forest than has been previously reported. This makes species migration easier. Over the last 50 years the world has reduced the amount of land by 68% to produce the same amount of food. See here. Most of this efficiency improvement is due to technology, but about 16% is due to CO2 fertilization. So CO2 fertilization benefits species by increasing forests and reducing the agriculture land use of humans. Unfortunately, policies that subsidize biofuels to reduce CO2 emissions cause a destruction of forests to increase land area used for biofuel crops.
It was previously though that slow moving species may become extinct due to global warming based on simplistic modeling. Almost 40% of lizard were forecast to become extinct by 2080, but new research shows those forecasts are off target as they do not include a realistic distribution of shade. Old models falsely assume shade occurs in large clumps, but the shade is distributed as many small patches of shade in the habitat, so lizards can easily travel from shade to shade. See here. CO2 fertilization is increasing the shade areas.
A dietary analysis of ancient teeth suggests that animals may prove more adaptable than expected. The study shows that animal make large changes in their diets in response to climate change. Predictions of species extinctions are based on models in which the animals don 't alter their feeding habits. The authors of the study say these models don 't account for flexibility in the tolerances of some species , see here.
9. It Hasn 't Warmed Since 1998
This is similar to alleged myth 5. The graph presented in section 5 showing an 18 year hiatus of lower atmosphere warming does not imply that the earth 's climate system had stopped accumulating heat energy during that period, rather it demonstrates that natural climate cooling factors had totally offset all the greenhouse gas warming during the period, which is almost impossible according to climate models. Therefore the models are shown to be too sensitive to greenhouse gases. The Skeptical Science page presents a graph of ocean heat content continuing to increase during the hiatus period. However, using this data and surface temperature data corrected for urban development and the millennium warming cycle, an equilibrium climate sensitivity to CO2 emissions is determined to be only 1.0 °C, which is equivalent to only 0.6 °C warming from 2016 to 2100, here. Actual temperature may go up or down depending on the direction and magnitude of natural climate change.
The webpage says using the Cowan & Way temperature index the global surface warming trend for 1997 2015 is approximately 0.14 °C per decade. By comparison, the average of the UAH and RSS satellite temperature records of the lower troposphere shows a 1997-2015 trend of 0.12 °C/decade. The Cowan & Way value includes some urban warming contamination. Both indexes include the millennium warming of 0.008 °C/decade and warming due to the 65-yr ocean oscillations of the PDO and AMO of about 0.05 °C/decade. We are now at the top of the 65-yr cycle, so climate change over the next few decades will likely be small.
10. Antarctica Is Gaining Ice
The alleged myth is [Ice] is expanding in much of Antarctica, contrary to the widespread public belief that global warming is melting the continental ice cap." The webpage acknowledges that sea ice around Antarctica has been increasing. It says Antarctic sea ice is gaining because of many different reasons . Antarctica has 90% of the Earth 's ice. The Nov. 7, 2015 update reports that a study by Zwally et al 2015 shows that total Antarctic land ice is increasing. It provides a link that states Just because Antarctica might be gaining ice doesn 't mean climate change isn 't happening . Yes, but it does mean that global warming isn 't global. CO2 is increasing in the Antarctic regions the same as elsewhere, but natural climate cooling has dominated CO2 warming there. The sea surface temperature around Antarctica has been declining for 40 years. See our article on the Zwally paper here. Antarctica is gaining about 82 billion tonnes of ice per year since 2003. The analysis used satellite data which measure elevation changes of the ice top. Ice loss estimate depend strongly on the amount of uplift of the bedrock, called Glacial Isostatic Adjustment (GIA).
Global Positioning System data (GPS) measures the bedrock uplift along the coast and shows that GIA models overestimate the uplift by 4.9 to 5.0 mm/yr. Recent research shows that previous estimates of Antarctic ice mass during the last ice age was too high, and that melting during the Holocene was overestimated, so that past uplift estimate were too high. The IPCC estimate of Antarctic ice loss of approximately 147 Gt/yr over 2002-2011rely on gravity survey (GRACE) estimates using obsolete GIA adjustments that were know by the IPCC authors to be obsolete. Zwally et al 2015 reports that the new, lower GIA estimates impact the altimeter ice mass estimates by less than 17% of the impact on the gravity ice mass estimates. Since the impact of the problematic GIA adjustments is six times larger on GRACE estimates than altimetry estimates, it is clear that the altimeter estimates are more reliable than the gravity survey estimates. The more accurate altimeter based estimate of Antarctica mass gain of about 82 Gt/yr is consistent with the increasing sea ice around Antarctica.
The climate models simulate Antarctic sea ice declining by 1 million sq. km from 1980 to 2005 while the observations show an increase of 300,000 sq. km by trend analysis. These observations are in direct opposition to the model-based predictions of the IPCC. See Antarctic ice expansion shows climate models unreliable here. See our Polar Regions and Glaciers section here.